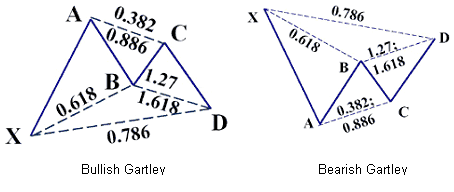
Bullish and Bearish Gartleys

There’s a great quote accredited to Chinese philosopher, Lao-Tsu “Knoweldge is the treasure, but practice is the key to it”. As any experienced trader will tell you – timely and correct recognition of chart patterns is a prerequisite for successful trades based on technical analysis. And this comes with practice and repeated exposure.
While some charts are quite simple and easy to identify, others can be quite complex, consisting of combinations of several simple patterns. Adequate knowledge of these patterns can enhance your ability to make more successful trades.
One such pattern, known as the Gartley, is a harmonic pattern, whose foundation was laid by HM Gartley in 1932. Harmonic patterns are based on price/time movements that adhere to the Fibonacci ratio relationships and their symmetry in markets. Fibonacci ratios help identify key turning points, retracements and extensions, along with a series of swing high and low points, and provide price levels for targets and stops.
Understanding Gartley Patterns
Gartley patterns are one of the most traded harmonic patterns that are actually a retracement and continuation pattern that occurs when a trend temporarily reverses direction, before continuing on its original course. Identification of these patterns provides traders with a low risk opportunity to enter the market on completion of the pattern and resumption of the trend. These patterns can be both bullish and bearish.
Gartleys are five-point patterns that resemble an M or W pattern, with 5 key pivot points. Comprising of two retracement legs and two impulse swings or legs, these patterns are associated with the Fibonacci ratio. The buy pattern will always look like an “M,” with an elongated front leg, while the sell pattern will always look like a “W,” with an elongated front leg.
Identifying the Bullish and Bearish Gartleys
Let’s first look at the features of a Bullish Gartley and how to identify them:
Similar to the AB=CD harmonic pattern, a bullish Gartley has an extra leg XA, where the price of a commodity or a currency pair rises sharply from point X to point A. This leg is followed by a change in the direction of the price and a retracement of some of the increase, as represented by the leg AB. In an ideal situation, the leg AB will make a 61.8% Fibonacci retracement of the leg XA. Any retracement beyond the point X makes the whole pattern invalid.
In the next stage, the price changes direction again and moves back up to form a third leg, BC, with a retracement of 38.2% to 88.6% of the length of the AB leg. Again, any retracement beyond point A will make the pattern invalid.
The last stage or the CD leg is the most important segment of this pattern, and a trader can look to enter into a trade at the point D, which is reached when the leg has achieved a 78.6% retracement of the XA leg. Again, if the price retraces beyond point X, the pattern is no longer valid.
In ideal situations, point D of the Gartley pattern should also represent 127%-161.8% of the BC leg.
The sequences get reversed in case of a bearish Gartley. Now, once the pattern is complete with the formation of the last leg, a trader can look to place an order, use a stop loss to manage the risk involved and place a profit target as per their trading objectives and the overall market conditions. Advanced trading platforms can place Fibonacci levels that help in determining the retracement and extension of prices automatically to the charts.
Gartley patterns are highly useful patterns that occur frequently and allow traders to go long (in case of a bullish pattern) or short (in case of a bearish pattern) at the point of their completion and the resumption of the trend.
Disclaimer
If you liked this educational article please consult our Risk Disclosure Notice before starting to trade. Trading leveraged products involves a high level of risk. You may lose more than your invested capital.


