

Crude Reality: Reasons Behind Falling Oil Prices
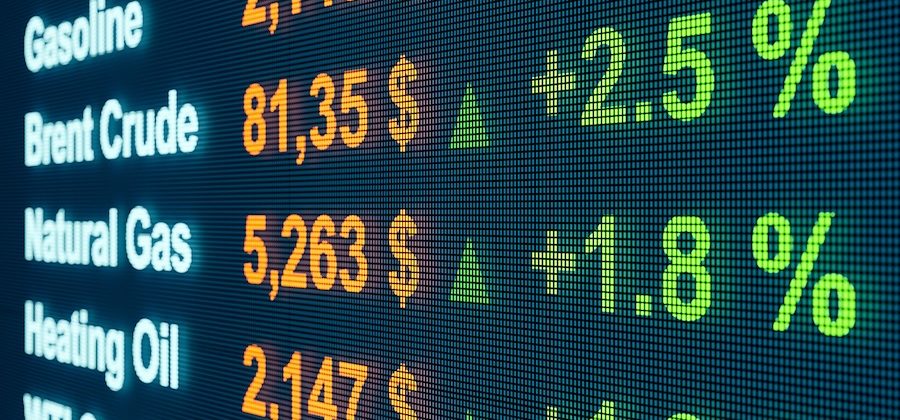
Crude oil prices declined 7.5% in August 2025, reaching $64.01 per barrel. The US Energy Information Administration (EIA) expects Brent crude to trade below $60 per barrel by the end of 2025. Expectations of a large supply overhang, while demand prospects remained foggy, weighed on oil prices. Here’s what you need to know for trading oil through Q4 2025.
Why Oil Prices Declined in August 2025
Several factors affected oil prices through August.
The August report from the EIA anticipated a continued increase in US production, reaching an all-time high of 13.6 million barrels per day (bpd) by December 2025. This fuelled bearish sentiment.
Meanwhile, the end of the summer driving season in the US weakened demand, weighing on oil prices.
OPEC+ confirmed the continuation of unwinding voluntary cuts, indicating a surge in oil supply through September. This further impacted investor sentiment, which weighed on oil prices. After this, the International Energy Authority (IEA) raised its global supply growth forecast to 2.5 mb/d for 2025.
JP Morgan expects a slowdown in demand surge at 800 kilo barrels per day (kbpd) till the end of 2025. This is 300 kbpd lower than JP Morgan’s previous forecasts. Natasha Kaneva, Head of Global Commodities Strategy at JP Morgan, indicated that the production surge increased the risk of a market reset during 2025-2026. Lower demand adversely affects investor sentiment.
What to Expect from Oil Markets
Oil prices may remain under pressure due to the interplay of declining demand and excessive supply.
In the last week of August, the US commercial oil inventory revealed a surprise build-up of nearly 2.4 million barrels, instead of the expected drawdown. This highlighted weaker-than-expected domestic demand. This may continue to weigh down investor sentiment through the remainder of 2025 and into 2026.
Continued tariff uncertainties could keep supply chains vulnerable to a significant shift. India, especially, has been resisting US pressure to stop oil imports from Russia in September 2025. This has prompted President Trump to continue to threaten to weaken trade ties with the rapidly growing economy. Weak demand from the Indian market could further impact US oil exports.
As geopolitical risks persist, supply chains continue to remain at risk while Trump threatens tariffs. Wars in the EU and the Middle East add to the uncertainty, keeping oil prices volatile. On a global level, alternative suppliers can buffer oil supply, at least in the near term.
In the long term, a shift to renewable energy sources and electric vehicles may suppress the demand for oil and other fossil fuels.
Trading Oil Amid Price Uncertainties
As oil prices remain under pressure, beginner traders may experience a lack of trading opportunities. However, derivative instruments, such as contracts for difference (CFDs), can help you explore opportunities in bear markets as well. You can speculate on the potential price difference using leverage to amplify your market exposure. However, remember that trading on margin amplifies potential risk and, hence, both profit and loss potential. Therefore, managing risk and adequately hedging your positions is important.
Oil Trading Strategies
You can consider the following strategies for trading oil via CFDs:
Scalping
Given that oil is forecasted to trade close to $64 per barrel, you can try scalping to explore tiny price movements. This means you capture multiple small opportunities by entering and exiting several positions within an hour. This is a high frequency trading technique and requires precise timing and constant monitoring.
News Trading
The oil markets are sensitive to news. Staying updated on the latest news events can help you capture market movements through news trading. You can take positions immediately after news releases if you are sure of the direction the market may move in. You can also choose to wait for the market response to fade and open trades accordingly.
Technical Analysis for Trading Oil
Technical analysis helps you make informed decisions about position sizing, entry and exit points, and risk limits. Here are a few indicators you can add to your oil trading strategy:
Bollinger Bands
Bollinger Bands determine consolidation and potential breakout. Narrow bands indicate price consolidation. As they expand, traders can expect price volatility. Traders can open positions at a price bounce off any of the bands or a breakout of the upper or lower band.
Relative Strength Index
The Relative Strength Index (RSI) indicator signals when the market is oversold (<30) or overbought (>70). Oversold conditions signal a potential bullish reversal, while overbought conditions signal a potential bearish reversal.
A possible trading set-up could be when the price bounces off the lower band of the Bollinger channel while RSI is in an oversold state. This is a signal to open long positions. A possible take-profit limit could be the middle band or the upper band, depending on the strength of price momentum.
Alternatively, a price bounce off the top Bollinger band, while RSI indicates an overbought market, signals a potential bearish reversal. This is a signal to take short positions.
To Sum Up
- Crude oil prices declined by 7.5% in August 2025, reaching $64.01 per barrel.
- The US and OPEC+ boosted oil production, creating a supply surplus.
- The end of the summer driving season and weak demand from countries like India contributed to the price drop.
- The shift to renewable energy is expected to suppress future oil demand.
- Using derivative instruments like CFDs can help you explore the opportunities in bear and bull markets.
- Technical indicators, such as Bollinger Bands and RSI, can be used to make informed decisions.
- Risk management is crucial when using leverage or trading volatile markets.
Disclaimer:
All data, information and materials are published and provided “as is” solely for informational purposes only, and is not intended nor should be considered, in any way, as investment advice, recommendations, and/or suggestions for performing any actions with financial instruments. The information and opinions presented do not take into account any particular individual’s investment objectives, financial situation or needs, and hence does not constitute as an advice or a recommendation with respect to any investment product. All investors should seek advice from certified financial advisors based on their unique situation before making any investment decisions in accordance to their personal risk appetite. Blackwell Global endeavours to ensure that the information provided is complete and correct, but make no representation as to the actuality, accuracy or completeness of the information. Information, data and opinions may change without notice and Blackwell Global is not obliged to update on the changes. The opinions and views expressed are solely those of the authors and analysts and do not necessarily represent that of Blackwell Global or its management, shareholders, and affiliates. Any projections or views of the market provided may not prove to be accurate. Past performance is not necessarily an indicative of future performance. Blackwell Global assumes no liability for any loss arising directly or indirectly from use of or reliance on such information here in contained. Reproduction of this information, in whole or in part, is not permitted.

