

Fear and Volatility: Trading Stock Indices Amid US-Iran Conflict
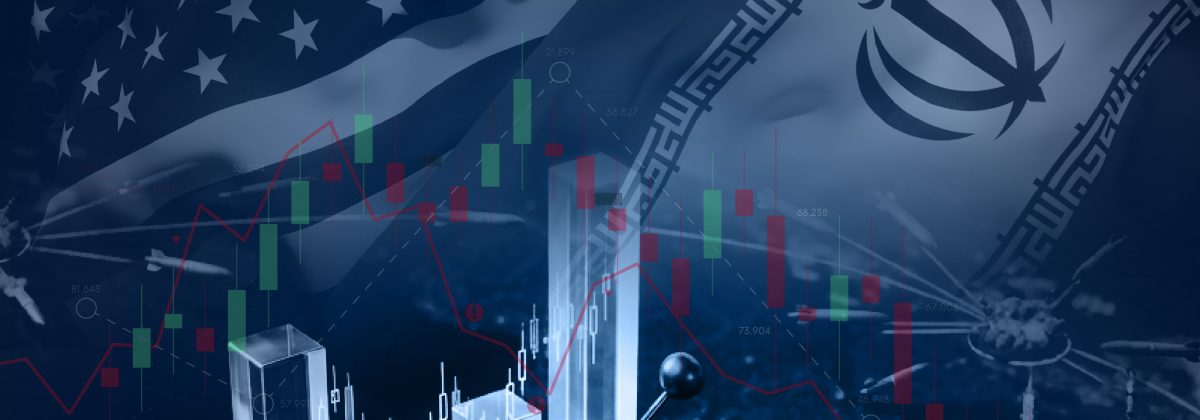
A week after the US-Israel-Iran conflict began, the Wall Street fear index had surged 10% by March 3, 2026. Geopolitical conflicts tend to have a ripple effect across the financial markets, affecting trader sentiment, liquidity and price movements of almost every asset class. The ongoing Middle East conflict has induced volatility and uncertainty across the global equity markets. Stock indices react sharply to events like the closure of the Strait of Hormuz, which blocks over 20% of the global energy supply.
Volatility Across the Stock Markets
The VIX surged 23%, reaching 27.30 on March 3, 2026, the day just after the Strait of Hormuz was officially closed. Major indices slumped. While the DJIA lost over 800 points, the S&P 500 and Nasdaq Composite declined by over 1.5%.
This surge in volatility reflects rising uncertainty and demand for downside protection. Increased volatility leads to wider intraday swings and may even cause a shift in the correlation between assets. However, this volatility also creates opportunities for trading indices.
Markets React with Risk-Off Sentiment
Wars tend to trigger a risk-off sentiment in the global markets. The immediate risk is that of an escalation in the conflict, which would lead to a prolonged disruption in the energy supply chain.
In the medium term, energy supply shocks could affect corporate margins and consumer demand. In the US, this brings the Fed into focus. The US central bank had planned at least two rate cuts through 2026. However, the war has increased the risk of a recession in the country. Against the current backdrop, the Fed may be forced to decide whether to control inflation or support growth. This is because higher interest rates may hamper growth as corporate spending remains low but keeps inflation in check.
Trading Indices in a Fear-Driven Market
In uncertain times, traders tend to move fast and exercise extra caution. A few strategies to consider while trading indices are:
News Trading
The impact of geopolitics on the markets often follows a pattern. Initial escalation of conflict gives rise to fear, which triggers a sell-off, weighing on the stock market. After the market digests the news, the price may partially recover as the initial panic subsides. Use volatility indices to gauge market fear levels before entering new positions.
Traders holding long positions might sell during the initial news phase, while others who wait for the initial panic to subside can enter at the low and take advantage of the relief rally. Note that the volume is massive during initial selling and may subside during the relief rally. Watching the selling momentum can help you discover when the selling pressure decreases, and it is time to buy to take advantage of the price recovery. Events, such as diplomatic discussions, are early signals of a potential relief rally.
Range Trading
Even in volatile markets, indices may find temporary equilibrium zones. Institutional buying, policy expectations and valuation support tend to create support and resistance levels. Scalpers and intra-day traders tend to buy near support and sell near resistance.
It is crucial to consider the potential of breakouts while range trading during wartime, as any news may trigger a breakout.
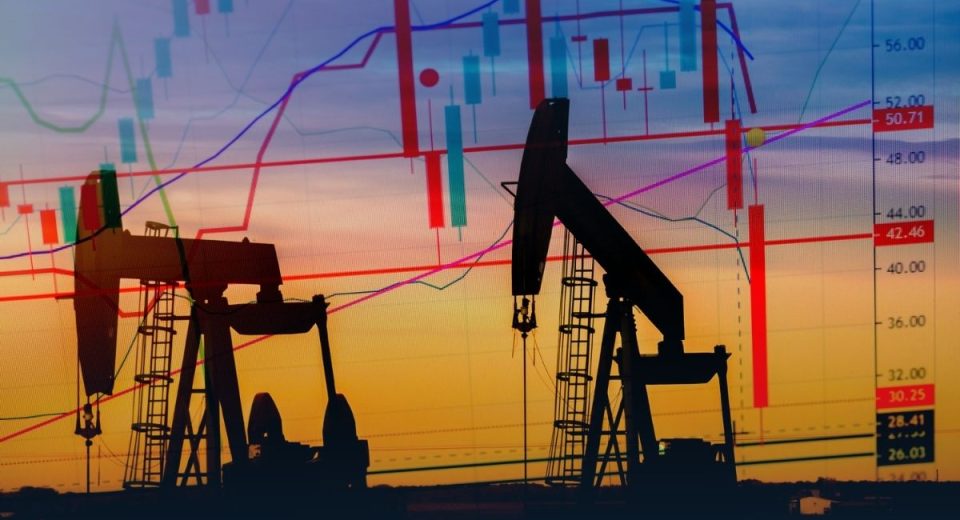
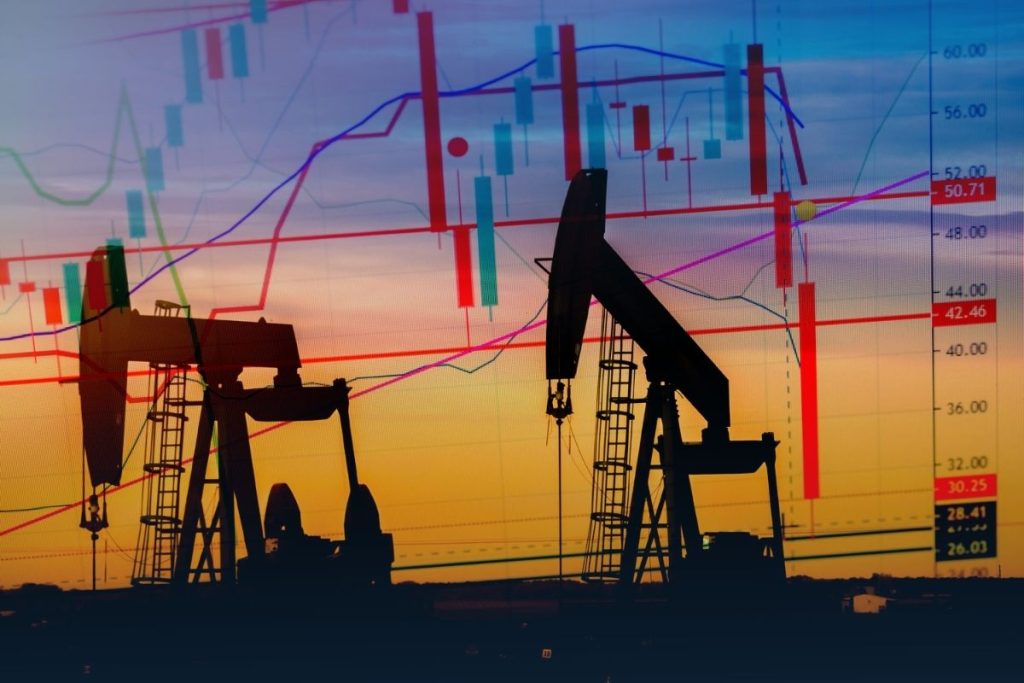
Trading Sector-Based Indices
Usually, different sectors react differently to the news. For instance, defence stocks may surge due to increased demand from military spending, while energy stocks may benefit from a surge in fuel prices. So, defence-heavy and energy-centric indices may offer more trading opportunities, while technology or consumer-based indices may not. Additionally, alternate energy suppliers may benefit from the supply constraints in the Middle East. Demand for oil and gas from non-Gulf energy producers may surge, pushing the indices of these nations higher.
Developing a Trading Strategy
Keeping your strategy flexible is critical when the markets are highly volatile. You may have to respond quickly to breaking news. A few variables to add to your watchlist are:
- Intensity of conflict impacts trader sentiment. For instance, escalating conflict heightens fear in the market.
- Energy price trajectory may ripple to indices. Stabilising energy prices may mean decreased volatility in indices as well.
- Central bank policies may offer insights into geopolitical conditions. Dovish policies may indicate a sustained risk of continued military escalations.
- Global economic indicators, such as VIX, NFP report from the US and GDP forecasts, could also impact benchmark indices.
Risk Management in High-Volatility Environments
Wartime uncertainty could lead to extremely fast price moves, price gaps and increased sensitivity to news events. Here are a few things to keep in mind:
Turn on Notifications
Stay updated with the news, as it can move the markets fast. But wartime environments are filled with speculation, rumours and unverified reports. Traders must rely on credible news sources and structured analysis instead of following social media tips.
Manage Position Sizes
In high-volatility markets, sizing your trades adequately becomes even more critical. A good practise is to limit exposure per trade to 1%–2% of your capital.
Time Your Exits
Stop-loss and take-profit orders help you exit when either the market unfavourably or your trade target is met. This reduces the risk associated with unfavourable price movements. Trailing stops can be particularly effective during sustained trends.
Diversify Your Holdings
Diversification across non-correlated assets prevents risk concentration. During geopolitical crises, safe havens, such as gold and the USD, often strengthen. The demand for consumer essentials also tends to surge, while that for luxury goods declines. Another technique is to diversify geographically, as reducing exposure to direct conflict zones can help mitigate the risk on any extreme events that may lead to sudden price swings.
To Sum Up
- The US-Israel-Iran conflict has induced volatility in the equity markets.
- Fear sentiment rises and traders tend to adopt risk-off trading techniques at such times.
- Trading indices requires understanding the broader sentiment and how it affects the dominant sector in the index under consideration.
- Your trading strategy must be flexible as you may have to make quick decisions with news releases and market reactions.
- Risk management is crucial for trading in high-volatility, high-uncertainty environments.
Disclaimer:
All data, information and materials are published and provided “as is” solely for informational purposes only, and is not intended nor should be considered, in any way, as investment advice, recommendations, and/or suggestions for performing any actions with financial instruments. The information and opinions presented do not take into account any particular individual’s investment objectives, financial situation or needs, and hence does not constitute as an advice or a recommendation with respect to any investment product. All investors should seek advice from certified financial advisors based on their unique situation before making any investment decisions in accordance to their personal risk appetite. Blackwell Global endeavours to ensure that the information provided is complete and correct, but make no representation as to the actuality, accuracy or completeness of the information. Information, data and opinions may change without notice and Blackwell Global is not obliged to update on the changes. The opinions and views expressed are solely those of the authors and analysts and do not necessarily represent that of Blackwell Global or its management, shareholders, and affiliates. Any projections or views of the market provided may not prove to be accurate. Past performance is not necessarily an indicative of future performance. Blackwell Global assumes no liability for any loss arising directly or indirectly from use of or reliance on such information herein contained. Reproduction of this information, in whole or in part, is not permitted.
