

What are Financial Market Cycles?

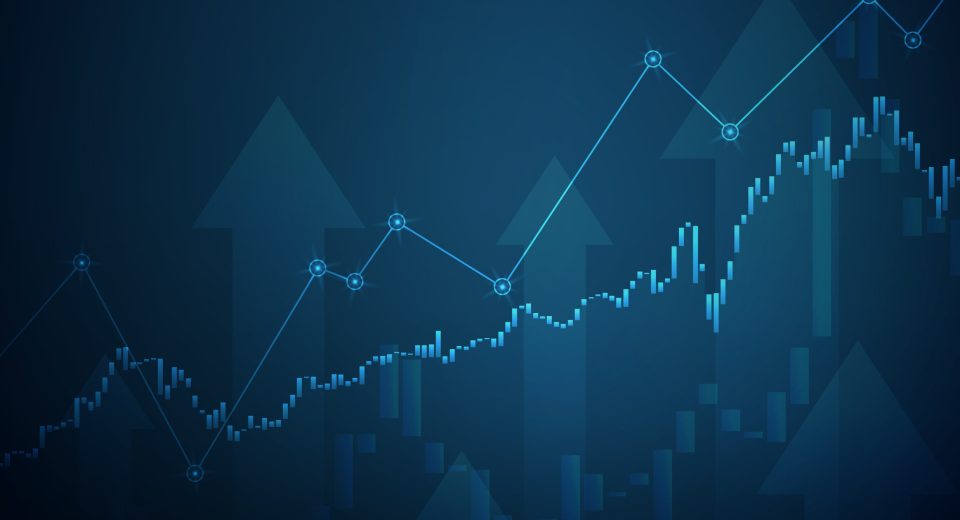
Technical analysis proves that the financial markets move through distinct repetitive cycles. This theory of market cycles tells us that cyclical forces, in terms of both buying and selling pressures, determine the price action of assets. Then, there are economic cycles too. Understanding the correlation and differences between market and economic cycles can help traders time their strategies and create portfolios accordingly.
For instance, the stock markets can reach peak points just before the economy peaks. On the other hand, market cycles can disappear for a certain time period or even change their momentum temporarily. The better a trader can identify or predict such phases, the more sound decisions they are able to make.
Types of Financial Market Cycles
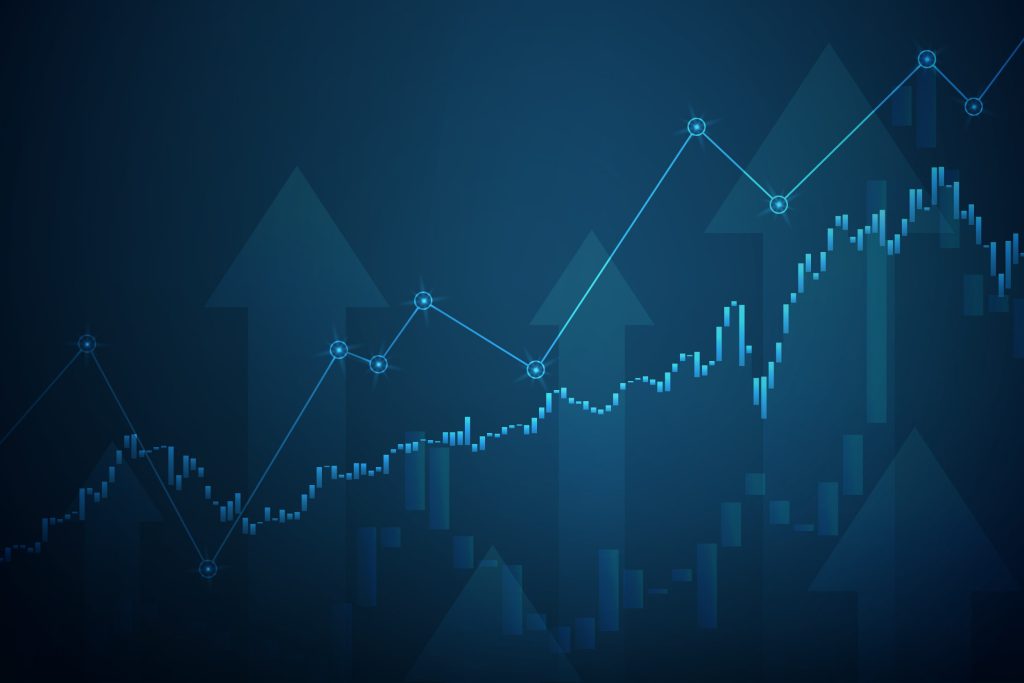
Technically speaking, there are 4 distinctive phases of market cycles. At different stages of these full cycles, various assets will react in disparate ways. For instance, in market downtrends, safe haven assets like the USD/JPY pair or gold trading becomes popular. The stock market could continue to climb higher, even if the economy is on a downturn. These cycles take both fundamental and technical analysis into consideration, where asset prices and other indicators are used to gauge the cyclical behaviour of the markets.
Expansion/Accumulation Phase
The market expands as a result of economic growth, where investors seek to buy more. After a peak, it eventually bottoms out. At this stage, experienced traders and smart money managers start buying again, on the premise that the worst is over. The market tends to remain bearish, although valuations become attractive. Prices are low, and for every seller who wishes to get rid of an asset, there is someone willing to buy it at a discount. Overall, the market sentiment is more neutral.
Mark-Up Phase/Peak Phase
At this stage, the market has been on a steady momentum, and begins to inch higher. The earliest technical analysts, who are able to gauge this uptrend, start getting into positions. Although media reports signify that the downtrend is over, economic indicators continue to be disappointing. As this phase begins to wean off, the participants who fear being left out get in, and increase trade volumes. Valuations are inflated, as greed and fear set in, and trading logic is ignored. Prices eventually begin to level off. Market sentiment moves from neutral to bullish.
Distribution Phase/Contraction Phase
This stage of the market cycle is dominated by sellers. The bullish sentiment gradually changes into a mixed sentiment. Prices trade within a range, which can last up to weeks or months. At the end of this phase, the market can change direction. Typically, chart patterns like head and shoulders or double and triple tops can be seen here. Highly negative geo-political news can quickly accelerate price downturns.
Mark-Down Phase/ Downtrend /Trough
Asset prices go down again. Those who are still holding positions sell off to salvage whatever value they can. This selling spree further pushes price downwards. Market sentiment here is that of downright pessimism.
From here, the market again moves towards the expansion phase slowly. Early innovators end up buying depreciated assets, hoping to sell them at higher prices when the market climbs.
Knowing which phase the market is in, helps in something called cyclical investing. When the economy is on a recovery path, there is an increase in consumer spending and businesses try to increase their efforts to meet demand. In recessionary periods, consumers reduce spending activities and businesses tighten production in the face of reduced demand. Most market cycles precede the economic cycles. There are 6 distinct periods in economic cycles:
- Early recovery: Good for tech stocks and other small-caps. Real estate prices fall, and bond yields grow.
- Mid-recovery: Characterised by falling interest rates and rise in inflation linked bonds. The capital goods and energy sector does well, so does trading in precious metals.
- Late recovery: Early bear market. Consumer non-cyclical, utilities and healthcare industries perform well. The phase is characterised by rising overseas reserves and rise in commodities prices.
- Early recession– Falling shares and defensive sectors make news. Consumer cyclical goods industry thrives. Short-term government bonds rise and so do interest rates.
- Mid-recession: Rising unemployment and corporate bond prices. Interest rates are also on the high and so are short-term government bonds. Financial stocks offer some solace.
- Late recession– Along with financials, the transportation sector grows. Unemployment rates continue to climb higher.
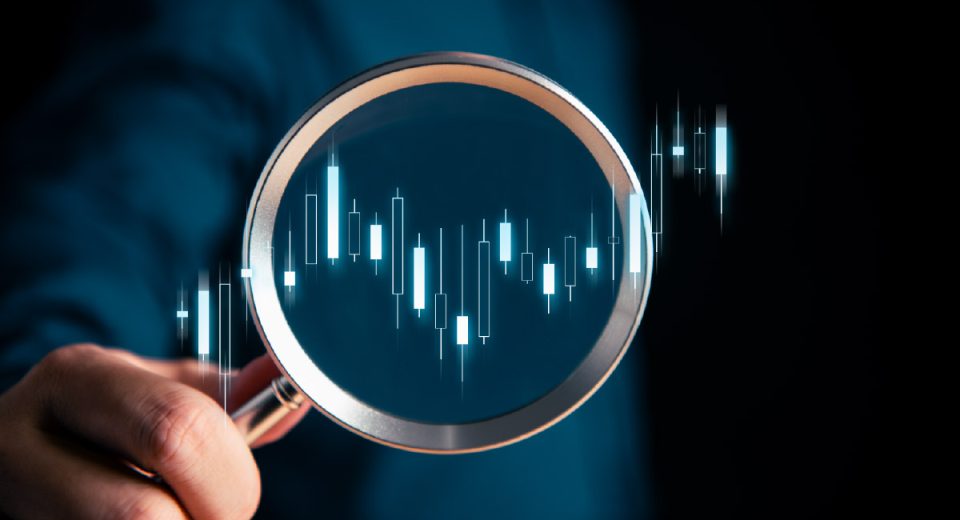
Identifying Market Cycles
Price changes can be viewed in percentage, rather than in absolute terms; when looking for market cycles. Traders can consider logarithmic price charts in order to compare price movements in a longer timeframe and identify the maximum level of price changes.
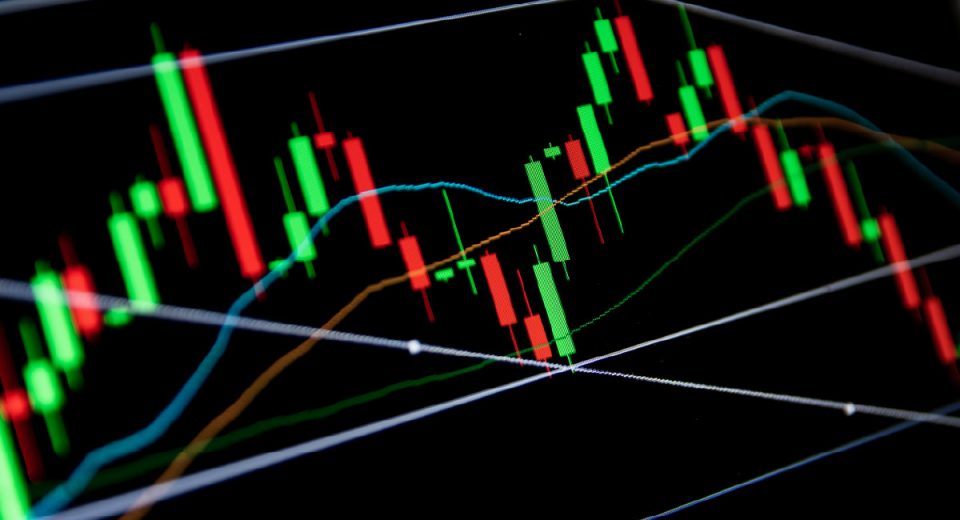
Random market noise can be eliminated by specific technical indicators like 5-day Moving Average (MA) or 20-day Simple Moving Average (SMA). This smoothening effect helps identify the price minimums in times of high volatility.
Visual charts to analyse price highs and lows can be used. Traders can aim to find the price low points that have the same cycle length, and then compare this with other cycles.
Many traders also use macroeconomic indicators like ‘Presidential Cycles’. This is more in sync with the US markets, which react to presidential regimes. The first and second half of the US presidential term is considered. It has been historically seen that the S&P 500 rises more in the second half of the presidential term.
Other such theories are the 6-month cycle, proposed by Yale Hirsch in 1986. Here, the November to April period is generally considered bullish for Wall Street investors, whereas the period from May to October is considered bearish.
A cycle can last anywhere between a few weeks to years, depending on the market being studied and the timeframe being looked at. Once understood, the knowledge of market cycles can significantly add value to technical analysis. However, these cycles do not always play out like textbook terms. Some cycles stay for shorter-than-expected periods, others disappear and some even fail. This is why technical indicators should always be used along with them to carefully tread the markets. Lastly, risk management tools like stop-loss and take-profit remain critical for every market cycle and trading decision.
Reference Links
- http://www.forex-central.net/analysis-of-financial-market-cycles.php
- https://www.investopedia.com/terms/m/market_cycles.asp
- https://www.investopedia.com/trading/market-cycles-key-maximum-returns/
- https://medium.com/stockswipe-trade-ideas/timing-market-cycles-4c49a8d2d80d


