

The 5 Most Popular Forex Chart Patterns

On-chart price action patterns, or chart patterns as they are popularly called, can provide a lot of information to traders within a limited time period. Each of these chart patterns has a tendency to show price moves in a particular direction, which is why they can be useful to understand volatility. Many others provide information regarding volume.
The basic premise is similar to that of support and resistance levels. There are mainly three categories of market participants in the forex market: buy side, sell side and hold strategists. As the ratio between these three branches change over time, so does demand and supply. Based on the collective opinions of market participants on where the prices is headed, fluctuations occur.
Trends and oscillations accumulate to form patterns. Technical analysts believe that if these price patterns are identified promptly, price directions can become predictable to a certain extent.
A wide range of patterns have been identified and labelled over the years. Here’s a look at the 5 most common ones.
1. Triangles
Commonly found in longer timeframes, triangles are formed when prices meet with the highs and lows of the day to form a tighter price area. Longer term patterns like these usually take more bars of data to form. The pattern contains two flat trendlines, which are either ascending or descending. Here, the price usually moves between these two trendlines. Three common triangles known to forex traders are ascending, descending and symmetrical triangles.
a) Ascending Triangles
Here, the price follows a rising trendline, where the swing highs are joined together with a horizontal line, while the swing lows form a rising line, such that the two lines come together to form a triangle. This pattern is often known as a continuation pattern, since the price tends to breakout in the direction of the trend. A break, through the resistance levels, usually spurs a rally in the price.
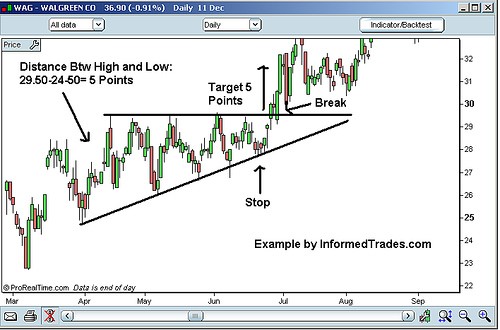
Source: https://commons.wikimedia.org/wiki/File:Triangle-ascending-example.jpg
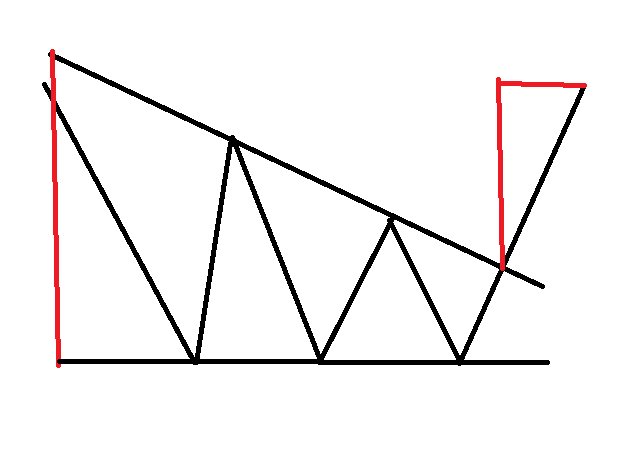
b) Descending Triangles
The opposite of the ascending triangle, the descending pattern provides bearish signals to traders, giving hints that that the price is expected to move downwards after the pattern is completed. It consists of a flat support line, and a downward sloping resistance line. A break in the support line is usually followed by a decline in price.
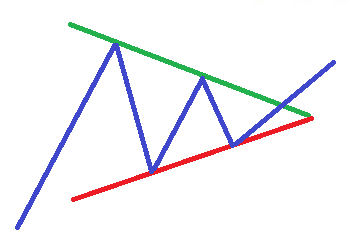
c) Symmetrical Triangles
Symmetrical triangle patterns are made up of an upper trendline connecting a series of declining peaks and the lower trendline connecting a series of rising troughs. This patterns usually signals a period of consolidation within a trend, after which the trend might resume. In addition, volatility usually declines as the pattern advances. Symmetrical triangles can signal bearish or bullish markets, while a breakout in either direction indicates a new trend.
2. Engulfing Pattern
Engulfing patterns can be easy to identify. They could be a powerful indicator of rapid changes in price direction. Engulfing candlestick patterns can be bullish or bearish. In bullish engulfing, a down-candle real body is completely engulfed by the next up-candle real body, in a downtrend.
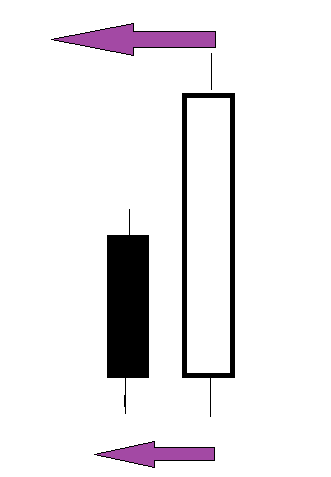
Image: Bullish Engulfing
In a bearish engulfing pattern, the prior up-candle real body is completely engulfed by a down-candle real body, in an ongoing uptrend. Patterns like these provide clues regarding the market sentiment. Traders can choose to enter a trade when retracement occurs within the engulfing pattern. They could also choose to trade in the direction of the engulfing pattern, in a shorter timeframe.
3. Head and Shoulders Pattern
This is one of the easiest formations to trade, since the pattern appears across all timeframes and could have defined entry and stop levels, as well as price targets. The left shoulder signifies a price hike, and then a subsequent decline. The head of the pattern shows the peak reached by the price, following which it once again moves to higher levels. A decline occurs once more, followed by a consequent price rise, which is lower than the peak price level of the head.
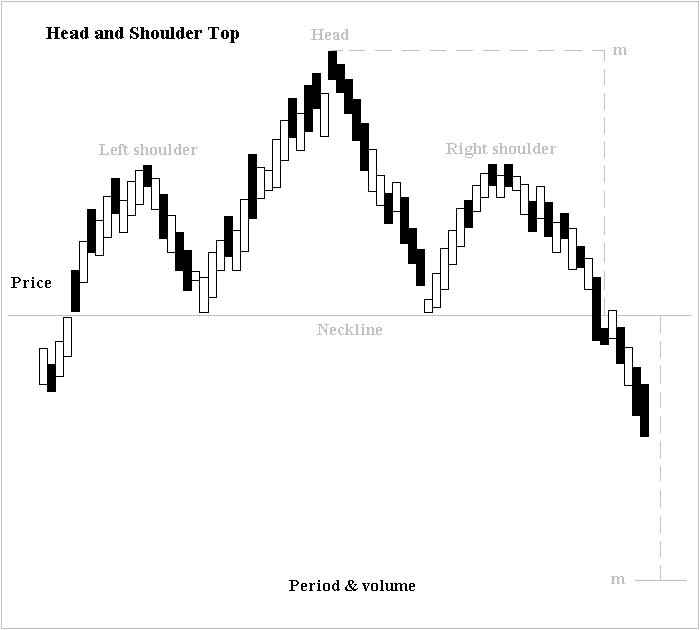
Source: https://en.wikipedia.org/wiki/Head_and_shoulders_(chart_pattern)
In a similar manner, inverted head and shoulders can form in market bottoms. Usually, the pattern is reliable when the right shoulder is smaller than the left. These patterns can be useful in predicting breakouts and looking for minimum price targets.
4. Wedge Patterns
Rising and falling wedges are considered good reversal patterns. Wedges form when after strong price trends, the price swings begin to contract in defined cycles. A rising wedge points towards a future downtrend. It can be defined as having higher lows and consecutive higher highs, until the price consolidation becomes stagnant.
Falling wedges have prices consolidating downwards, normally followed by an upward breakthrough. These are defined by lower lows and lower highs. They can help predict an upcoming uptrend.
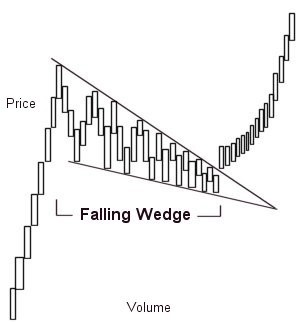
Source: https://en.wikipedia.org/wiki/Wedge_pattern
5. Rectangles
Rectangles are consolidation patterns, which means that the price is stuck within a defined range. In fact, it is the price action before the formation that gives clues regarding the future price direction. Bullish rectangles are preceded by upward price momentum and are usually followed by a continuation in the same direction, after the price breaks through the resistance line. After this, it makes a move that is the same size as the preceding rectangular range.
In bearish rectangles, a downtrend precedes the actual formation and continues after the pattern, when the price breaks through the support line. Bearish rectangles indicate that sellers are pausing their trades, before taking the price down further. Once price pushes beyond the support line, it typically makes a move that is equivalent to the size of the rectangle pattern.
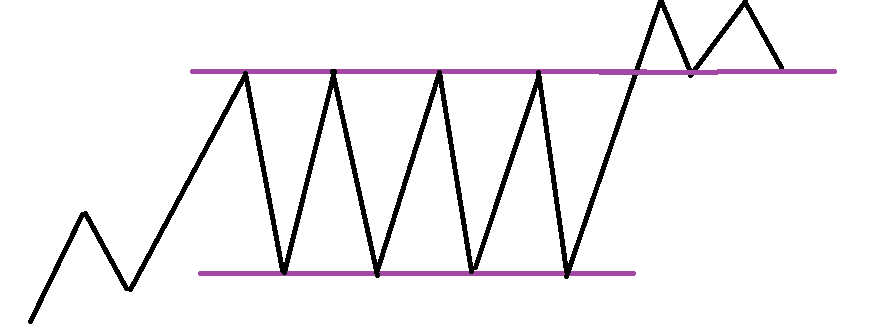
Image: Bullish Rectangle
Patterns are usually considered more reliable when they re-appear in longer time intervals as well. Experts believe that in short timeframes, they can produce false signals, which would need other technical indicators to be filtered out. Overall patterns can provide useful insights into entry and exit levels and planning stop-loss strategies. As traders progress, they can also choose to combine various patterns to create customised trading strategies. However, experienced traders prefer not to consider too many patterns at the same time, in order to avoid contradictory signals.
Reference Links
- https://www.investopedia.com/articles/forex/11/most-used-forex-patterns.asp
- https://www.babypips.com/learn/forex/how-to-trade-chart-patterns
- https://www.nasdaq.com/articles/common-forex-chart-patterns-2019-06-07
- https://www.tradingwithrayner.com/chart-patterns/
- https://forextraininggroup.com/analyzing-chart-patterns-to-improve-your-forex-trading/


