

How to Use Peak-and-Trough Analysis in Trading
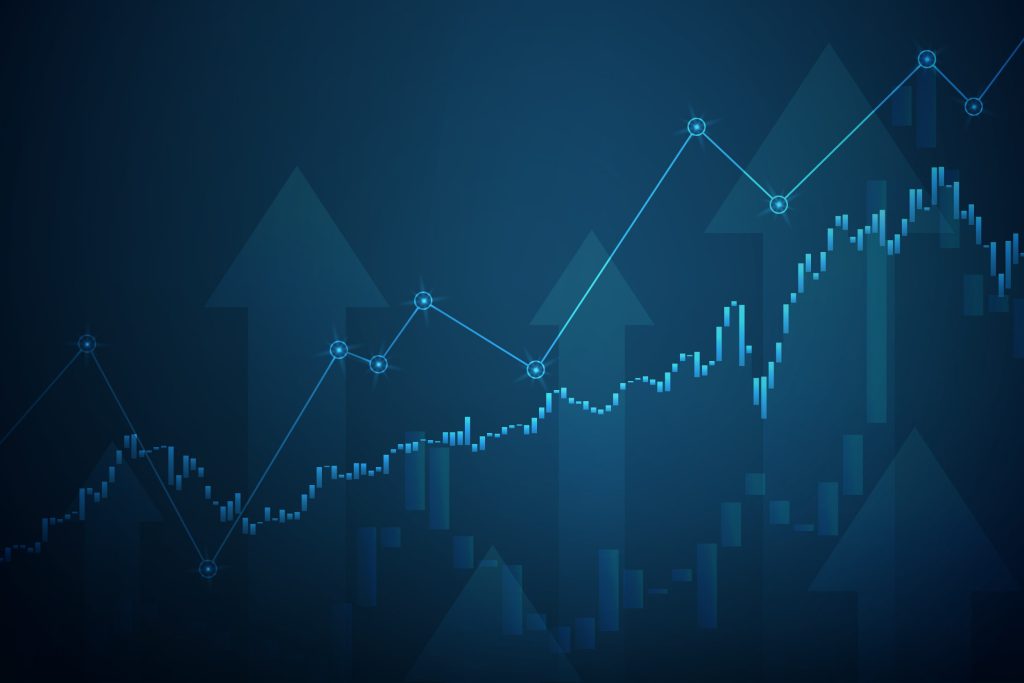
Prices rise, reverse, fall and reverse again, forming peaks and troughs. These ups and downs are the pulse of the financial markets, creating opportunities for traders. The key is to understand the structure behind each move. With its origins in the Dow theory on the markets, the peak-and-trough analysis technique helps traders do just that.
What are Peaks and Troughs?
Peaks are the high points where the price rises and stalls before it starts falling again. A trough is a low point to which the price drops before it starts to rise again.
Valid peaks and troughs occur when the price reaches a new high or low within a move, or when a counter-move against the prevailing trend retraces roughly one-third to two-thirds of the prior price movement.
Peaks and troughs offer several types of insights into market movements, such as:
- Whether bulls or bears are in control.
- Is the market momentum steady or fading?
- What are the natural support and resistance levels?
Determining Market Trends
Peak and trough analysis helps determine the ongoing market trend.
Uptrend
When each new peak and trough is higher than the previous peak and trough, respectively, the market is considered to be trending up. In this case, buyers are in control. The steeper the peak/trough, the greater the momentum. Shallow or flatlining peaks usually indicate declining market momentum.
Downtrend
In a downtrend, lower and lower peaks and troughs form consecutively. This indicates that sellers are in control of the market.
Ranging
In ranging markets, consecutive peaks and troughs form at roughly the same level. The price line moves horizontally, signalling indecision in the market.
Identifying Potential Reversals
Another popular use of peak-and-trough analysis is to get early signals of a potential reversal.
Uptrend Reversal
When the height (the difference in price level) of consecutive peaks starts to decline or lower troughs form, traders can start looking for signs of a reversal.
Downtrend Reversal
When the price forms higher lows and higher highs, traders consider it a signal of weakening bear strength.
Gauging Market Momentum
Understanding momentum is critical to determining how long you can ride the current trend, or whether it is weakening and it is time to switch from a trend trading strategy to a reversal trading one. Here’s how you can determine the strength of the trend:
During a strong uptrend, peaks and troughs are farther apart (greater difference in price highs and lows). The pullbacks are shallow, and the price slope increases during breakouts. When an uptrend weakens, peaks stop rising as fast. Troughs may become uneven and often deeper. The opposite occurs during a downtrend.
Deciding Entry and Exit Points with Peak-and-Trough Analysis
During an uptrend, a higher trough indicates a price pullback. Traders consider opening long positions at this point. Additionally, a high-momentum breakout above a previous peak suggests a price upswing, which is also considered a signal to buy.
During a downtrend, a lower peak or a breakdown below the previous trough are considered selling points.
Risk management is also quite intuitive with peak-and-trough analysis. The previous peak is considered a support level in an uptrend. Similarly, the previous trough is regarded as the support level during a downtrend. These are used for setting stop loss levels.
Combining Peak-and-Trough Analysis with Other Indicators
Being based on pure price action, peak-and-trough analysis generates early signals. But it is also prone to false signals. This means confirming the signals with other indicators is important.
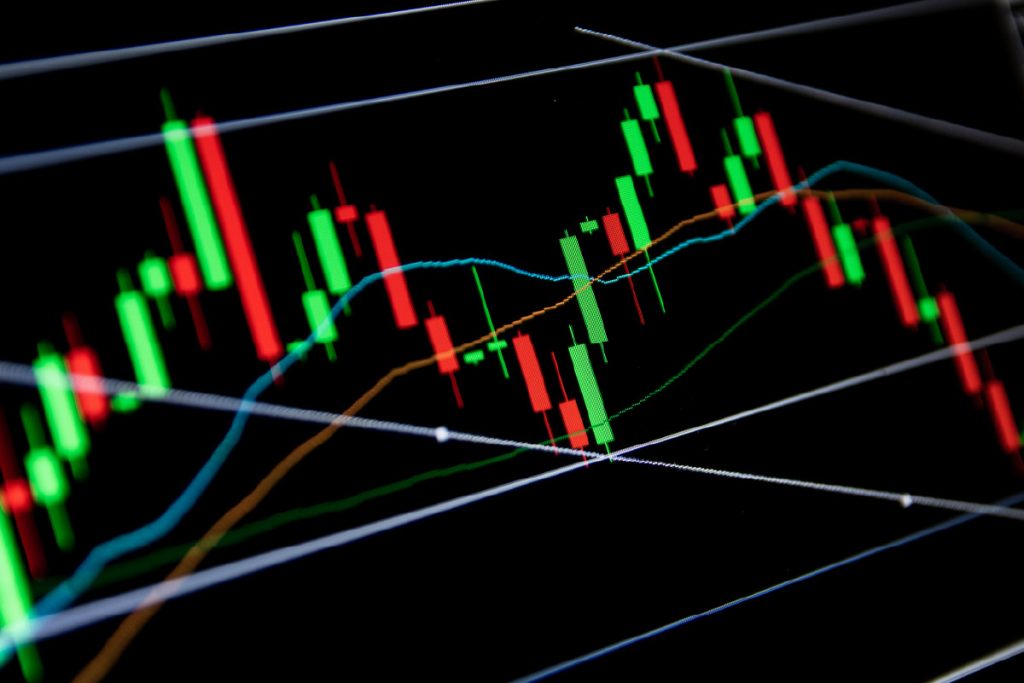
Combining with Moving Averages (MA)
In an uptrend, the price often pulls back to a key moving average, such as the 50-day or 200-day MA. This line then acts as a dynamic support level. Traders tend to buy near the trough if it aligns with the MA. When an uptrend fades, a trough below the 200-day MA is used to confirm the reversal.
Using MACD/RSI in Peak-and-Trough Analysis
MACD and RSI are oscillating indicators. They show divergences between price action and broader market sentiment. For instance, when the price makes a higher peak, but the indicator (RSI/MACD) makes a lower peak, it indicates that bullish momentum is fading and a reversal may be on the horizon.
Volume with Peak-and-Trough Analysis
Volume indicators, such as OBV, are often used in peak-and-trough analysis. During an uptrend, in ideal situations, volume should increase as a new peak is formed and remain low during a pullback. This confirms that the market is committed to the direction. When the price breaks out of a consolidation with high volume, it signals a strong upswing. But when the volume is low, it is considered a fake-out. Additionally, when volume suddenly rises with a sharp uptick in price, traders consider it as an exhaustion signal and prepare their reversal strategies.
To Sum Up
- Peak-and-trough analysis is a visual method for assessing market trends.
- It helps identify the current market direction and speculate on reversals.
- The method relies on observing highs (peaks) and lows (troughs) in price movements.
- This technique can be used to determine market trends, get early signals for reversal, determine entry and exit points, and gauge market momentum.
- Traders often combine peak-and-trough analysis with technical indicators, such as RSI, MA, OBV, etc., to confirm signals and make informed decisions.
Disclaimer:
All data, information and materials are published and provided “as is” solely for informational purposes only, and is not intended nor should be considered, in any way, as investment advice, recommendations, and/or suggestions for performing any actions with financial instruments. The information and opinions presented do not take into account any particular individual’s investment objectives, financial situation or needs, and hence does not constitute as an advice or a recommendation with respect to any investment product. All investors should seek advice from certified financial advisors based on their unique situation before making any investment decisions in accordance to their personal risk appetite. Blackwell Global endeavours to ensure that the information provided is complete and correct, but make no representation as to the actuality, accuracy or completeness of the information. Information, data and opinions may change without notice and Blackwell Global is not obliged to update on the changes. The opinions and views expressed are solely those of the authors and analysts and do not necessarily represent that of Blackwell Global or its management, shareholders, and affiliates. Any projections or views of the market provided may not prove to be accurate. Past performance is not necessarily an indicative of future performance. Blackwell Global assumes no liability for any loss arising directly or indirectly from use of or reliance on such information here in contained. Reproduction of this information, in whole or in part, is not permitted.