

Oil Prices Defy 2026 Projections Amid US-Iran Conflict
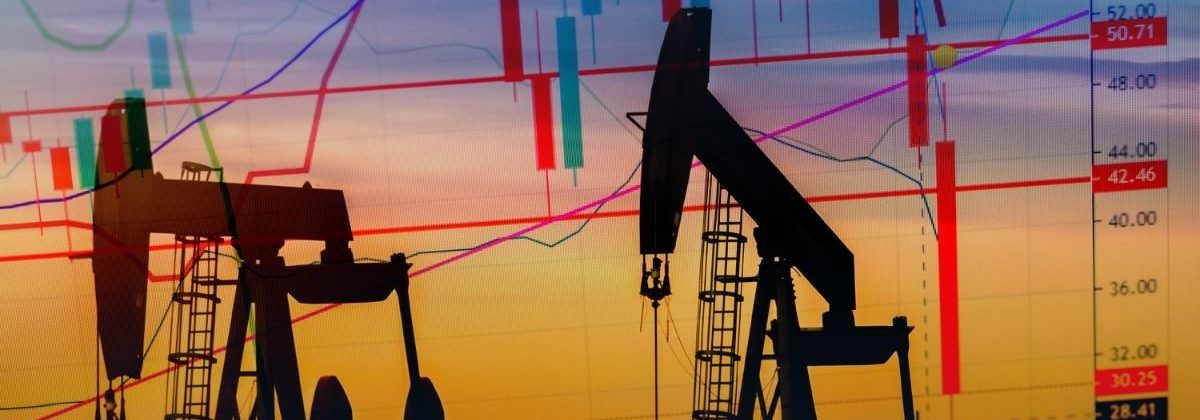
Oil prices plummeted nearly 26% in 2025. As the year has turned, investors wondered whether 2026 will see more upside. It turned out to be very different from what experts projected, with oil markets fearing supply shocks after the outbreak of the US-Iran war on February 28.
The Gap Between Projections and Performance
The US Energy Information Administration (EIA) projected oil price to average around $56 per barrel (/b) in 2026, 19% below the 2025 levels. The 2027 forecast was even lower, at an average of $54/b.
The early 2026 projections have been rendered obsolete by the US-Iran conflict. Brent crude spot prices surged approximately 50% from the start of the year to reach averages above $94/b by early March.
The International Energy Agency (IEA) had projected global oil demand growth to rise throughout 2026. Demand was seen as growing by 930,000 bpd (barrels per day) in 2026. According to the organisation, emerging economies would continue stockpiling, which could potentially stabilise prices.
However, in March, the IEA cut its global oil demand growth forecast for 2026 by 210,000 bpd due to soaring prices. The agency warned that global oil supply could plunge by 8 million bpd day in March.
By mid-March, amid intensifying attacks, Brent crude surpassed $119/b and WTI crude almost touched $107/b following the closure of the Strait of Hormuz.
Factors That May Drive Volatility in Oil Prices
Factors that support oil prices:
The US-Iran War
While the war lowers energy demand due to travel restrictions, the closure of the Strait of Hormuz, through which roughly 20% of the world’s daily oil trade passes, created the largest supply disruption in the history of oil markets.
Economic Stimulus in Asia
China is the world’s largest oil importer. In early 2026, the Chinese government introduced new measures to boost the economy. If these measures lead to an increase in factory activity, they could support prices ahead.
Global Surplus and OPEC Production
Non-DoC liquids production in 2026 was forecasted to grow by approximately 0.6 mb/d, year-on-year (yoy). However, major producers from the Middle East, like Saudi Arabia, Iraq, Kuwait, and the UAE, were forced to cut production due to lower shipments on account of the US-Iran conflict. This intensified the supply shock. Will the supply surplus that was predicted for 2026 be replaced by projections of a deficit?
Factors that weigh on oil prices:
Interest Rates Remaining Higher for Longer
Central banks, including the US Fed, were expected to lower interest rates in 2026. With higher oil prices triggering fears of inflation, markets pulled back their rate cut speculations. Higher interest rates support the US dollar, which in turn lowers the demand for oil, as an appreciation in the greenback makes oil more expensive for foreign currency holders.
Emergency Reserve Releases
On March 11, IEA member countries agreed to release 400 million barrels of oil from their emergency stocks. This marked the largest emergency release in history. This is what helped pull Brent prices back toward the $90/b mark after the announcement.
Easing of Geopolitical Tensions
If peace is resorted in the Middle East, the OPEC+ nations may increase their oil output. Surpluses from the US, Russia and OPEC+ nations may weigh on oil prices for the remainder of the year.
Global Shift to Clean Household Energy
More households across the EU and North America are moving away from heating oil and gas and towards electric heat pumps and solar energy. As homes become more efficient, total oil demand may drop, affecting prices.
Transport Moving to Electric Vehicles (EVs)
The move towards green fuel is accelerating in the transport sector. The global EV market is expected to reach $4,925.91 billion, growing at a CAGR of 20.9% between 2026 and 2032. More EVs on the road mean lower gasoline demand. This change in how the world travels is on track to creating a long-term downward pressure on oil prices.
What to Watch for While Trading Oil CFDs?
Your oil trading strategy requires technical analysis and a constant consideration of news updates that impact market sentiment.
Geopolitical News
Look out for developments around the US-Iran and Russia-Ukraine conflicts.
Inventory Reports
Watch the weekly EIA storage data. Prices tend to rise when inventories fall.
OPEC+ Meetings
An update that OPEC plans to cut production is considered a buy signal as it limits supply. Supply deficits support prices.
US Dollar Index (DXY)
The US dollar and oil prices share an inverse relationship. An uptick in the DXY indicates a potential decline in oil prices.
EV Sales Data
Keep an eye on monthly vehicle registration reports. If EV sales continue to break records, the long-term outlook for oil may weaken further.
Strategies for Trading Oil with CFDs
Here are a few strategies you can practise to prepare for trading oil:
News Trading
You can watch the economic calendar and take advantage of important reports. Prices tend to surge after the EIA Inventory Report (US oil storage levels) and OPEC+ meetings indicate a decline in supply. Experienced traders wait for the first 60 seconds after a news release to let the markets digest the information and then make their move, based on broader market sentiment. You can use volume indicators, such as OBV, to determine trading direction momentum.
Range Trading
As the name suggests, traders use this when oil is moving sideways between known support and resistance levels. Traders buy when the price hits support and sell when it hits resistance, and exit sometime when the price is ready to reach the other end of the range. RSI and Fibonacci retracements are often used as key levels.
To Sum Up
- Major forecasts suggest oil prices may fluctuate between $54 and $58 per barrel.
- Global oil supply is expected to continue to outpace demand through 2026.
- The rapid switch to EVs may lower the need for gasoline worldwide in the long term.
- OPEC+ needs to choose between cutting production to raise prices or keeping it high to protect market share.
- Geopolitical tensions may cause spikes in oil prices.
Disclaimer:
All data, information and materials are published and provided “as is” solely for informational purposes only, and is not intended nor should be considered, in any way, as investment advice, recommendations, and/or suggestions for performing any actions with financial instruments. The information and opinions presented do not take into account any particular individual’s investment objectives, financial situation or needs, and hence does not constitute as an advice or a recommendation with respect to any investment product. All investors should seek advice from certified financial advisors based on their unique situation before making any investment decisions in accordance to their personal risk appetite. Blackwell Global endeavours to ensure that the information provided is complete and correct, but make no representation as to the actuality, accuracy or completeness of the information. Information, data and opinions may change without notice and Blackwell Global is not obliged to update on the changes. The opinions and views expressed are solely those of the authors and analysts and do not necessarily represent that of Blackwell Global or its management, shareholders, and affiliates. Any projections or views of the market provided may not prove to be accurate. Past performance is not necessarily an indicative of future performance. Blackwell Global assumes no liability for any loss arising directly or indirectly from use of or reliance on such information herein contained. Reproduction of this information, in whole or in part, is not permitted.
