

Single Candlestick Patterns: What to Look Out For?
The reason candlesticks are a popular technical analysis tool is that each one packs a lot of information. This offers valuable insights into price movement and market behaviour. Numerous trading strategies use multi-candlestick patterns. But did you know that in several cases, a single candlestick can be valuable to your trading strategy? The key is recognising what type of pattern works and when. For this, you must understand the key elements to look for when using a single candlestick pattern in technical analysis.
Key Elements to Look Out For
When trading single candlestick patterns, look for:
Colour
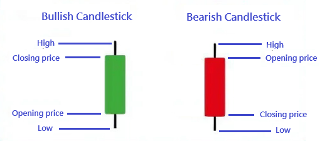
Most charting tools show bearish and bullish candles with different colours. Usually, a bearish candle is red or black. This means that for the candlestick duration, the asset’s opening price was higher than the closing price. A bullish candlestick is usually green or white, meaning a lower opening and a higher closing price.
Most popular trading platforms, such as MT4 and MT5, allow you to set the colour of the candlesticks. Recognising what your chosen colour means, especially during times of high volatility, when opportunities arise rapidly, is crucial to making a decision suitable for your trading strategy.
Body Size
The size of the real body (the rectangle between the open and close prices) indicates the intensity of buying or selling pressure.
Long bodies suggest strong momentum and that either buyers or sellers are in control. Short or non-existent bodies indicate market indecision or a period of consolidation.
Shadow (Wick) Length
The wick of a candle shows the high and low extremes of the price during the candle period.
Long shadows show significant price movement and rejection at those levels. A long lower shadow, for example, shows sellers pushed the price down, but buyers pushed it back up, indicating potential buying interest.
Short shadows suggest that most of the trading action happened within the open and close prices.
Position Within the Trend
This is the most important factor when using single candlestick patterns in your trading strategy. The reliability of a pattern depends on where it appears in the price chart. For instance, a reversal pattern is only significant during a trending market. In a sideways market, it may be ineffective.
Confirmation
A single candlestick signal cannot guarantee future price action. Look for confirmation from the next one or more candles. Combining other technical analysis indicators, such as MACD or Ichimoku cloud, can also offer confirmation to make informed trading decisions.
Trading Single Candlestick Chart Patterns
Here are a few of the popular single candlestick patterns:
Hanging Man
This is a bearish reversal pattern. Here’s what you look out for:
Colour: Black/red
Body size: Very small real body at the upper end of the price range
Shadow length: Lower shadow is very long, and the upper shadow is absent or too small to be significant
Position: Top of an uptrend
Confirmation: Long bearish candle with a bottom close to the close of the hanging man candle
Shooting Star
This is also a bearish reversal candlestick. Its characteristics are:
Colour: Black/red
Body size: Tiny, the real body is at the top of the price range
Shadow length: Long upper shadow, with an absent the lower shadow or one that is too small to be significant
Position: Top of an uptrend
Confirmation: Long bearish candle with both top and bottom below the shooting star’s real body
While the hanging man indicates that selling pressure is increasing, the shooting star indicates that the price is consolidating near resistance.
Hammer
Hammer is a bullish reversal candle. This shares several similarities with the hanging man, so note the differences carefully.
Colour: White/green
Body size: Very small, at the upper end of the price range
Shadow length: Longlower shadow, the upper shadow is absent or too small to be significant
Position: Bottom of a downtrend
Confirmation: Long bullish candle with small wicks, a bottom close to the top of the hammer and a body at least twice as long as that of the hammer
Inverted Hammer
This is also a bullish reversal candlestick. Keep an eye on:
Colour: White/green
Body size: Very small, the real body marks the lower end of the price range
Shadow length: The upper shadow is very long, and the lower shadow is practically insignificant
Position: Bottom of a downtrend
Confirmation: Long bullish candle with small wicks and a bottom close to the top of the inverted hammer and a body at least twice that of the hammer
Dojis
Dojis are candlesticks with tiny bodies, indicating that the opening and closing prices during the candlestick were virtually the same. Dojis can be tricky, so the things you look out for while trading this candlestick pattern are:
The candlestick before the Doji: Bearish or bullish
The overall trend: Remember that there could be a bearish candle even in an uptrend and vice versa
The price action: Is the price under a correction/pullback during the overall trend?
Position: Whether the Doji is forming near the resistance or support
Wick lengths: The lengths of the upper and lower shadows can offer meaningful insights
As the open and close prices are the same, the colour of the Doji does not offer helpful trading information.
| Type of Doji | Overall Trend | Price Action | Position of Doji | Wick Lengths |
| Standard Doji | Neutral/indecisive | Equal open and close | Mid-trend or consolidation zone | Short, near equal upper and lower wicks |
| Long-Legged Doji | Any | Wide range; strong tug-of-war | Mid-trend, often after volatility | Long upper and lower wicks |
| Dragonfly Doji | Downtrend (reversal) | Buyers push price up after drop | Near support | Long lower wick, little/no upper wick |
| Gravestone Doji | Uptrend (reversal) | Sellers push price down after rally | Near resistance | Long upper wick, little/no lower wick |
To Sum Up
- Single candlestick patterns are useful technical analysis tools.
- Note the colour, body size, size of the wick and position within a trend to read a single candlestick pattern.
- Traders also combine candlestick patterns with other technical indicators to gain a comprehensive view of the markets.
- Factors, such as when a candlestick appears and the candlestick that follows it, are as important as recognising the candlestick pattern.
Disclaimer:
All data, information and materials are published and provided “as is” solely for informational purposes only, and is not intended nor should be considered, in any way, as investment advice, recommendations, and/or suggestions for performing any actions with financial instruments. The information and opinions presented do not take into account any particular individual’s investment objectives, financial situation or needs, and hence does not constitute as an advice or a recommendation with respect to any investment product. All investors should seek advice from certified financial advisors based on their unique situation before making any investment decisions in accordance to their personal risk appetite. Blackwell Global endeavours to ensure that the information provided is complete and correct, but make no representation as to the actuality, accuracy or completeness of the information. Information, data and opinions may change without notice and Blackwell Global is not obliged to update on the changes. The opinions and views expressed are solely those of the authors and analysts and do not necessarily represent that of Blackwell Global or its management, shareholders, and affiliates. Any projections or views of the market provided may not prove to be accurate. Past performance is not necessarily an indicative of future performance. Blackwell Global assumes no liability for any loss arising directly or indirectly from use of or reliance on such information here in contained. Reproduction of this information, in whole or in part, is not permitted.