

The Naked Chart vs. Indicators

If you get supremely excited by looking at a range of technical indicators on your trading terminal, shiny new tools to add to your daily charts, then pause for a while. There are plenty of traders who would vouch for naked chart trading as the more useful alternative. Indicators are very useful, but trading strategies shouldn’t be based only on them. Both styles have their own advantages. Let’s take a look.
What is Naked Chart Trading?
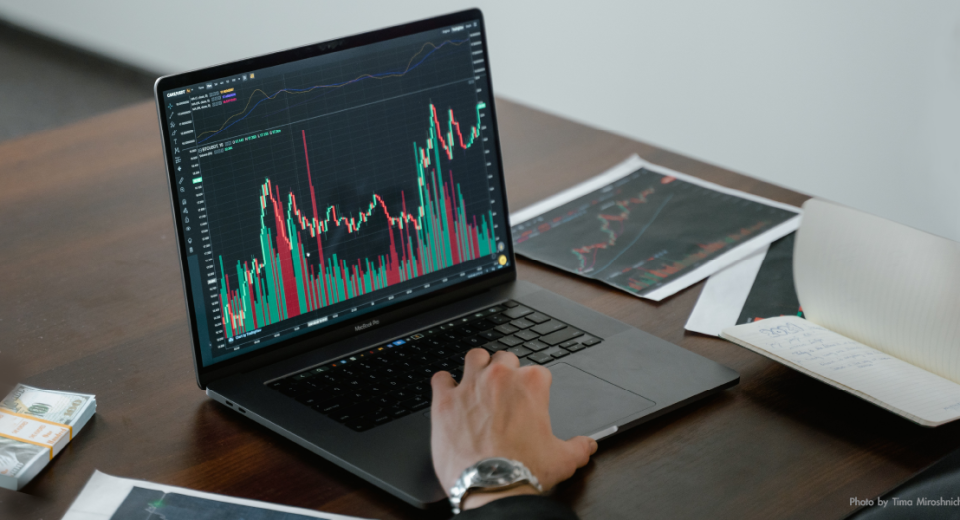
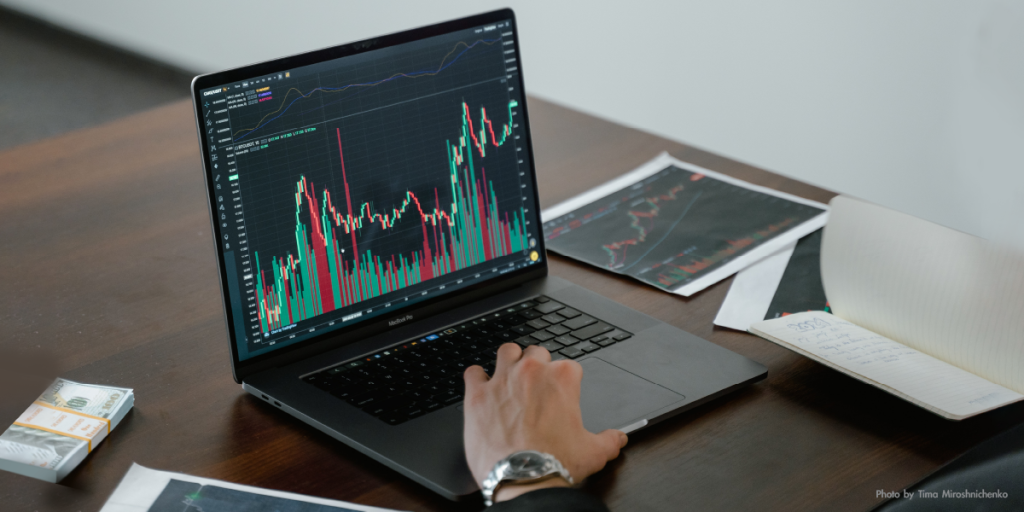
Also known as Price Action Trading, this style is associated with trading without any indicators on charts, based on real-time price trends. Here, traders often use plain candlestick charts or singular patterns like pin bars. Trading without indicators is generally chosen to keep the charts clean. Traders love their indicators, and sometimes use too many of them, which clutters the charts and the mind. Experts believe that trading should always be done on simple terms, since the market is highly competitive and handling the psychological aspects of trading is difficult in itself.
Price action is data in its purest form. Indicators are simply derivatives of these price actions on the charts, hence they are mostly lagging. Lagging indicators are indeed useful in spotting trends and reversals. However, if you want to develop a high probability trade strategy, a leading indicator like price action is more useful.
Overall Outline of Indicator-less Trading
The first step is to understand the market structure. This is about tuning yourself to the chart and studying the market momentum.
1. Identifying Market Direction
This step requires the trader to understand swing-highs and swing-lows. Market structure is the sum-total of these highs and lows on the chart. The order in which these new lows and highs occur will give you signals to determine the direction of the market. With this you can identify:
- Bullish and bearish trends
- New emerging trends
- Ranges between highs and lows
- Formation of major bottom-to-top
Swings are common around support and resistance levels. The process of identifying swings is discretionary and requires some practice. You may identify four types of swings – higher highs, higher lows, lower highs and lower lows.
- Uptrends: Continual series of higher highs, followed by higher lows
- Downtrends: Continual series of lower lows, followed by lower highs
- Consolidating trends: No particular swing patterns, wedge, channel or head and shoulders pattern.
A trending market can simply be defined from chart analysis, rather than using complex indicators. A bullish trend will continue to make higher highs and lows, signalling a buy. Bearish trends will generate lower highs and lower lows, where you would want to sell.
Ranging Markets are Tricky
Ranging conditions or neutral markets create undesirable trading conditions. Since the price is trapped between two levels, you will get to see highs and lows continuously at the same levels. Since no specific upper or lower boundaries can be defined, traders identify swing points in the same area. Price action gets messy around the range boundaries, making it difficult to spot reversals.
2. Spotting Reversals in Charts
Horizontal levels and trend lines can be used to identify price trend reversals. Many traders additionally use pivot points and Fibonacci levels for this. Support and resistance levels can point towards key points of reversals. Two likely scenarios exist here:
- Price continues to move along the major range support levels, where they turn around.
- Price retraces along the old support level, using that as the new resistance level to get reversed.
So, identifying uptrends and then the important support and resistance levels gives us likely turning points.
3. Identifying Trade Signals
We can rely on charts to generate buy and sell signals. In naked charts, this is highlighted by a candlestick reversal pattern. A bearish rejection candle is a common sell signal.
Advantages of Naked Chart Trading Over Indicators
Many traders believe that those who are trading by charts alone are at a significant advantage because they actually have the skills to read the actual markets, unlike those who rely on indicators, which entails more of intuition or luck. Indicators are just technical analysis tools that apply a formula to these price actions.
- Indicators are Lagging: The tools show results of past price action. They are, therefore, lagging, while price action trading is leading. However, traders can get rid of the lag by using a shorter-period setting for indicators. Remember, though, that indicators become less relevant with little information.
- Indicators Make Charts Messy: Using a couple of indicators is useful. However, traders often crowd their charts with numerous tools, creating confusion. Old trend lines on charts can cloud patterns and clearing them away can sometimes lead to better decisions. Also, indicators sometimes contradict each other, if used in inappropriate combinations. The combination of stochastic indicators with Bollinger Bands is considered a good option.
- Detailed Insight into the Markets: Instead of mindlessly watching price ticks, charts provide plenty of historical data that can be studied in detail to understand how the markets work. This is key to understanding how people react to different news releases and global events, and also important for growth as a trader.
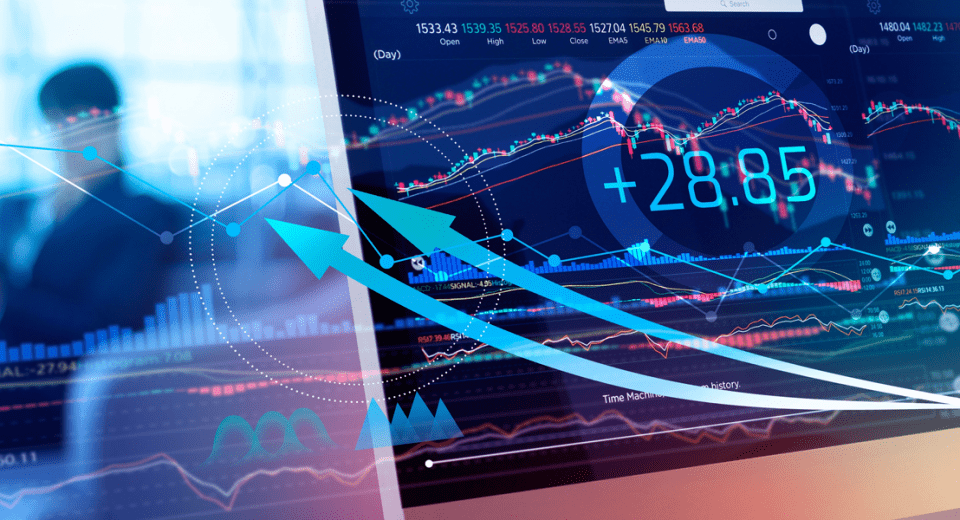
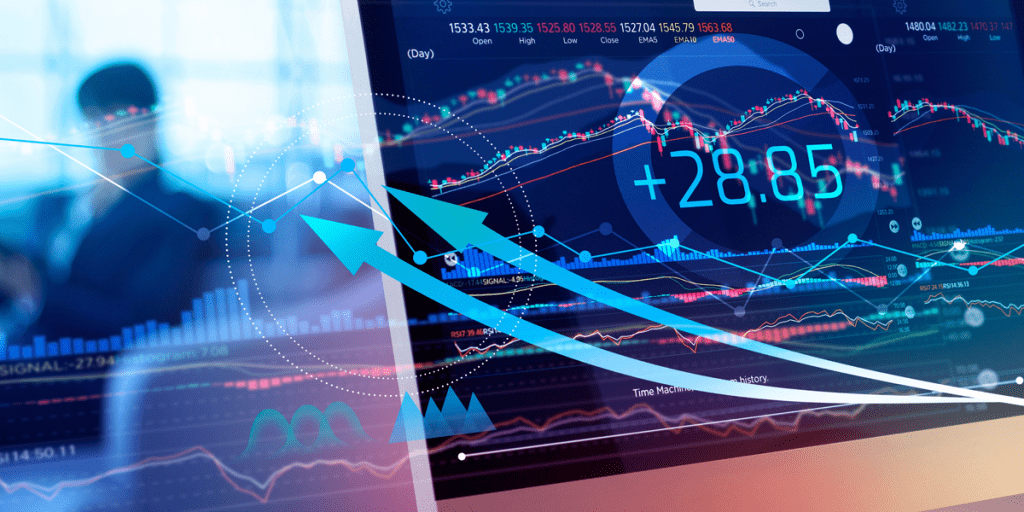
Advantages of Indicators over Naked Chart Trading
In this age of automated trading and expert advisors, indicators cannot be completely removed from the equation. The most common issue is that they are lagging. But, as explained earlier, this can be taken care of. In reality, price action also takes place on charts, after they are confirmed.
- Indicators Can Offer Clear Signals: A major advantage of indicators is that they give clear-cut signals that are completely non-subjective. Price action signals are comparatively difficult to interpret for a new trader. The quality and size of price action signals are subjective, seen in the overall context.
- Herd Mentality at Play in Price Action: Sometimes, the patterns are very obvious. A majority of price action traders enter into trades after obvious signals. The effects are expected and the price actions are rarely profitable.
- Indicators Provide Reference Points on Otherwise Plain Charts: Many traders argue that they feel lost by looking at blank charts. Decision making becomes harder with no reference points to guide them. Indicators can save a lot of time, since they focus on specific points of a chart.
In the end, it is all about the preferences of each trader. Traders have to use both tools wisely and then figure out which one helps in making better trading decisions.
Disclaimer
If you liked this educational article please consult our Risk Disclosure Notice before starting to trade. Trading leveraged products involves a high level of risk. You may lose more than your invested capital.
