

What is it and How to Trade the Gartley Pattern?

The Gartley Pattern, named after its inventor, HM Gartley, is one of the most classic retracement patterns followed by traders. It can help find early entry points in a potential long-term trend reversal, with minimum risk. Short-term day traders can identify reaction highs and lows on an intra-day basis with this pattern. Although the pattern was originally meant to serve only stock traders, traders soon realized that the pattern could work equally effectively in other markets too.
Harmonic patterns like Gartley are based on Fibonacci sequences, which are popular tools for technical analysts to identify breakouts and retracements in prices. Some harmonic traders refer to it as Gartley 222 or the 222 pattern, after the page number on which it was originally described in HM Gartley’s book, Profits in the Stock Market.
Gartley 222
Like other harmonic trading patterns, it has to meet specific Fibonacci levels, in order to validate a formation. The pattern looks like an M/W shape on the chart, based on whether it is a bullish or bearish Gartley. There are 5 points to look for: X, A, B, C and D.
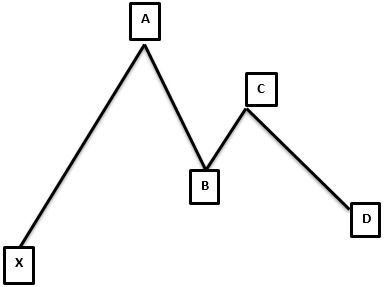
The pattern starts at X and then makes 4 swings, till Point D. Each of these swings need to be according to specific Fibonacci levels to qualify as part of the Gartley pattern.
Rules to Confirm the “Perfect” Gartley Pattern
Each component of the structure has to conform to certain rules, such as:
- XA: The XA formation could show any price activity on the chart. There are no specific requirements for this.
- AB: This move should be approximately 61.8% of the size of XA. So, if XA is bullish, the AB move will show a price reversal, reaching 61.8% Fibonacci retracement of XA.
- BC: The BC move has to either finish at the 38.2% Fibonacci level or the 88.6% level of the AB move. Again, this move needs to reverse the price action of the preceding AB move.
- CD: If BC is 38.2% of AB, the CD move needs to be a 127.2% extension of BC. If BC is 88.6% of AB, then CD needs to be 161.8% of BC.
- AD: In order for the Gartley pattern to be completed, one has to measure the AD move, right after the completion of the CD move. This move will take a 78.6% retracement of the XA move. Unless this move is completed, the pattern will not be considered valid.
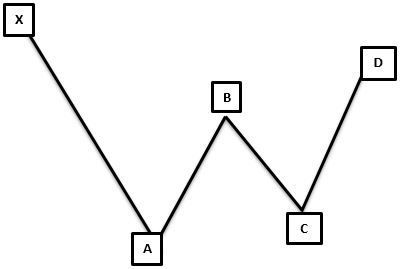
Bullish Gartley Pattern
The above figure is a bullish Gartley pattern, which looks like a M on the chart. There are 4 consecutive price swings or trends. A bullish ABCD pattern is preceded by a significant low point of X. The expectation of the pattern is a price reversal, following the CD move. This means that after the bullish Gartley, prices will proceed on to higher levels from Point D.
AB needs to be equal to CD upon completion, which means that the full target of the pattern should be 161.8% Fibonacci extension of the AD move. The bullish Gartley helps traders identify buy and sell points.
It reflects convergence of Fibonacci retracement, while the extension levels at D, which points to stronger support levels, is a strong indicator of market reversal. If it is found near the bottom of the downtrend channel, the bullish Gartley can indicate trend reversal. Traders use it to find a suitable risk/reward ratio, when trading the overall trend.
Bearish Gartley Pattern
This is exactly like the bullish Gartley, only inverted. This means that the XA move is bearish, AB move is bullish, BC is bearish and CD is bullish. Price is expected to decline from Point D. Here, traders usually attempt to sell at D.
Trading Gartley Patterns
Point D, which is a 78.6% retracement of the XA leg, is where the buy and sell signals are generated. At this point, there is a high probability that the price will reverse from its short-term trend and continue towards the long-term trend. If there is any significant move beyond these levels, the position can be exited, since the pattern will then be considered invalid.
Overall, if there is a bullish Gartley on the chart, a trader could open a long trade after looking for certain conditions, such as:
- Support for CD at 161.8% or 127.2% Fibonacci level of the BC leg.
- Price action moves in a bullish direction from the respective Fibonacci level.
A stop-loss order is a must for every entry signal. For a Bullish Gartley move, stop-loss can be placed right below D. Alternatively, it can be placed below the initial X point, for relatively less downside risk. In case of a Bearish Gartley, stop-loss orders can be placed above D.
Many traders look for a 61.8% retracement of the AD move to place a take profit order. However, take profit levels will depend on the situation. It can be placed at multiple levels to gain an average profit.
Many traders use Gartley patterns together with other chart patterns and indicators. The breakdown and break-out price targets can be used as support and resistance levels. Elliott Waves are another example of a harmonic pattern, which can be used to predict future price trends, based on the current price movements in relation to each other. The significant benefits of these chart patterns being used together is that they provide information on timing and strength of price movements. Technical indicators can help in identifying when the price is overbought or oversold.
On the MT4 platform, you can use the Fibonacci tool to mark the key levels on the chart. The Gartley pattern is a complex one and requires understanding of charts and indicators. If properly used, it can offer a trader retracement entry into trends at low-risk points, and that too with quantifiable risk levels.

