

Understanding Price Action in Forex Trading
Price action is the movement of the value of a currency, stock or commodity over a period of time. It is the foundation stone for the technical analysis of any type of market instrument. In fact, a lot of short-term traders depend only on price action and the trends and formations that are extrapolated from it to make trading decisions.
So, if you want to add a useful weapon to your forex trading arsenal, here are some things about price action that you should know.
What is Price Action Trading?
Price action trading is a strategy that involves making all your trading decisions on the basis of a “naked” or stripped-down price chart. This simply means that there should be no lagging indicators used, or, at the most, just a couple of moving averages to spot dynamic resistance and support areas.
Although global news events and economic reports move currency prices, they are only part of the story. The reason for this is that all announcements and economic data that matter are ultimately a part of price action on the forex chart.
Since price action shows the effect of all variables, including lagging indicators, for any period of time, there is no need to include them separately. Price action signals are all you will need to create your own trading system that could improve your potential for making successful trading decisions.
A collection of these indicators is known as price action trading signals. Effective use the such trading signals can help you predict future price movements with a high level of accuracy.
How can Price Action Be Interpreted?
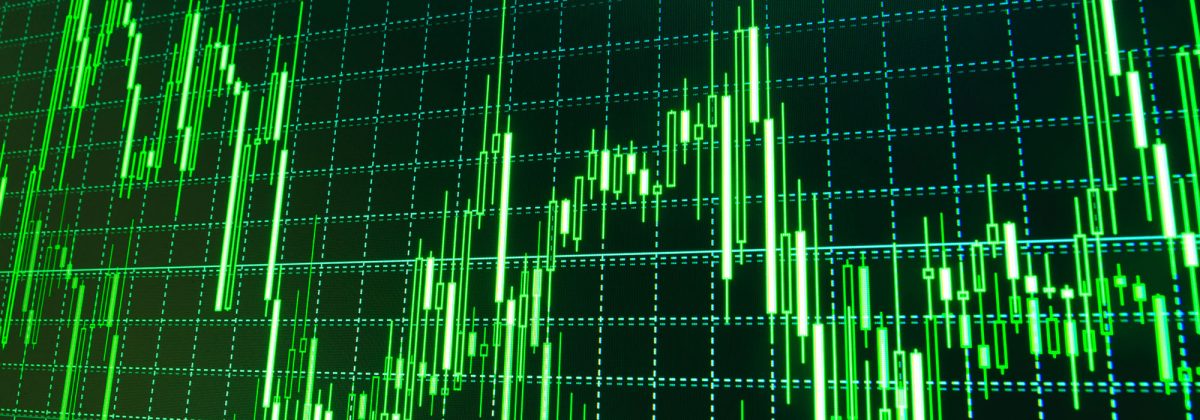
Price action can be interpreted with the use of charts that plot currency prices over time. Traders use different types of chart combinations to improve their skill of detecting and interpreting trends, reversals and breakouts. And, many of them prefer candlestick charts, since these charts can help with better visualisation of price movements. This is because they include high, low, open and close values with respect to up or down sessions.
Some types of candlestick patterns, such as engulfing pattern, Harami cross and three white soldiers, are examples of visually interpreted price action. Other than this, there are several other candlestick patterns that can be created off the price action to predict future price movement.
The same can be applied to other types of charts as well, such as box charts, figure and point charts and box plot.
Apart from the visual formations on the chart, technical analysts also use price action data for the calculation of technical indicators. The main aim is to find order in the chaotic and often random movements of currency prices.
For instance, an ascending triangle formed on a chart by applying trendlines can be used to predict possible breakouts. This is because price action shows that the bulls have tried to break out on multiple occasions and have seen an increase in the momentum each time.
How to Use Price Action in Forex Trading?
Due to the repetitive nature of the forex market participants and the way in which they react to global economic variables, price action tend to repeat in various patterns. Such patterns are also known as price trading strategies. Recurring price action patterns show the continuation or change in market sentiment.
In simple terms, by learning to identify price action patterns, you can gain insights into where the price of a currency is likely to move next.
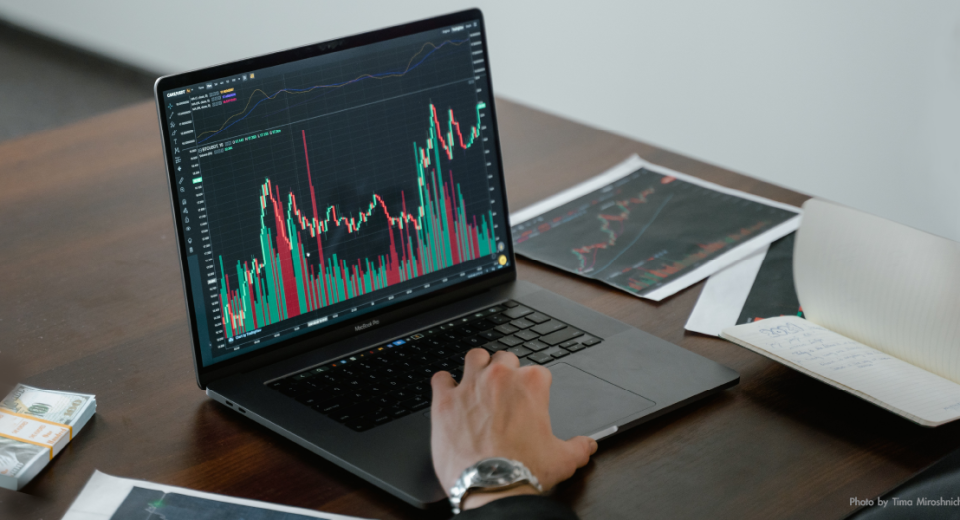
When you start off with price action trading, you first need to remove all the unnecessary details from your chart. So, eliminate all the indicators and expert advisor signals and just leave the raw price bars.
Keep in mind that you can choose between classic bar charts or candlesticks, based your preference. The one thing that makes candlesticks more popular than classic bars is their ability to represent price data in a more dynamic manner.
After you have removed all indicators and extra variables from your charts, you can start drawing the key chart levels and look for price action setups to trade from. One important use of trading with price action is to learn how to distinguish between a consolidating versus a trending market.
A market is considered to be in an uptrend if there are constant Higher Highs and Higher Lows (HH, HL) on the chart. Conversely, a downtrend is usually indicated when there are Lower Highs and Lower Lows (LH, LL).
The Hammer Price Action
A hammer pattern usually signals that sellers are pushing the market to a new low. The close and open price levels should be present in the upper half of the candle. Since sellers are not strong enough to stay at the low position and bail on it, this causes the market to come back to a high level. This leads buyers to enter the market. Conventionally, the close can be below the open, but the signal is stronger if it is above the opening price level.
Limitations of Price Action Analysis
The process of interpreting price action is highly subjective. It is very common for two traders to reach completely different conclusions while analysing the same price action. One may view it as a potential near-term turnaround, while the other might believe that there is a bearish downtrend.
Additionally, the timeframe under consideration also has an impact on how traders interpret currency price movements in the future. One important thing to remember is that predictions made through price action analysis of any timeframe are only speculative. You can confirm the accuracy of the predictions by applying other tools. The more tools you use, the more confirmation you will get on your trade.
Another thing to remember is that past price action does not, in any way, guarantee a future price action. High probability trades will still continue to be speculative, which means that you will have to take on risks while seeking potential rewards. So, regardless of your trading strategy, you need robust risk management measures in place.