

Understanding the Hammer Candlestick Pattern
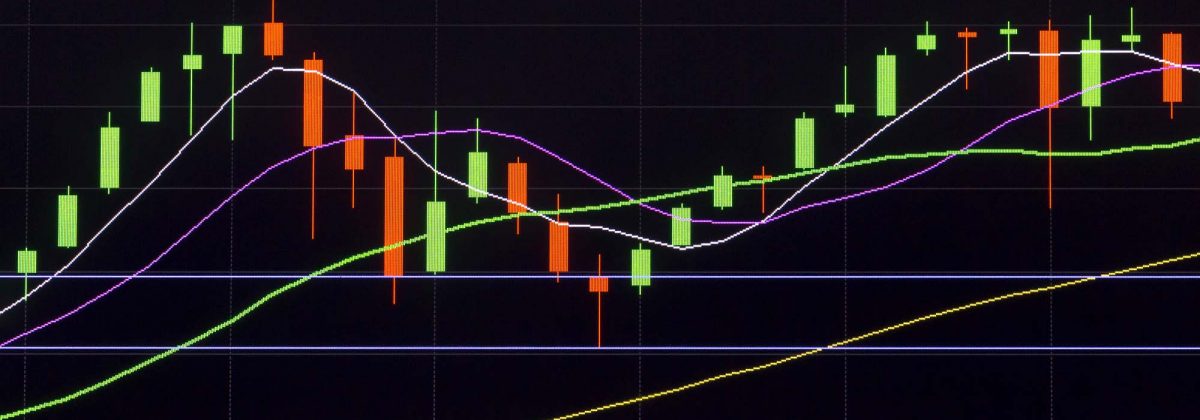
Candlestick patterns are among the most versatile technical indicators for understanding market movements. They act as great visual aids regarding the movements of the price of an asset over a certain time period. The patterns can also help traders gauge market sentiment for a certain financial asset. For instance, bullish candlestick patterns are formed when the price of an asset declines from its opening price, reaching close to the support level, only to bounce back to close at a high.
Talking of bullish candlesticks, a popular pattern is the hammer candlestick formation. The pattern normally forms near the bottom of downtrends, indicating that the market is attempting to define a bottom.
How to Identify the Hammer Pattern?
The price pattern occurs when an asset price trades significantly lower than the opening price but starts rising to close near the opening levels. The result is a hammer-shaped candlestick, where the lower shadow is at least twice the size of the real body. So, the open, close and high prices are roughly at the same levels.
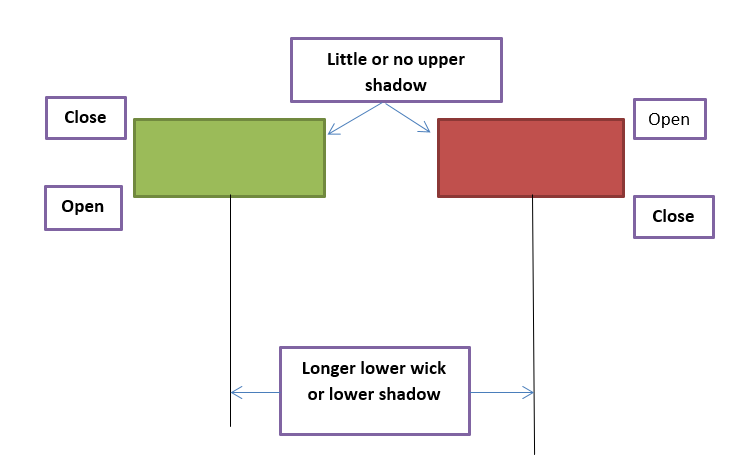
A bullish hammer pattern is formed when the high and close are almost at the same level. This is considered a strong formation, which indicates that the market opened with sellers dominating, but by the end of the period, buyers were able to push the price up. On the other hand, when the high and open are at the same levels, the formation is comparatively less bullish, as the bulls were able to neutralise the bears to a certain extent but were unable to close the prices above the opening level.
Hammers indicate potential panic selling by traders, during times of market decline, to form a bottom. This is followed by an increase in prices, indicating potential market reversal. All this takes place in the span of one period. The longer shadow indicates that the market attempted to locate support levels and demand. On finding the support area, the bulls pushed prices higher to reach close to the opening price.
Inverted Hammer Formations
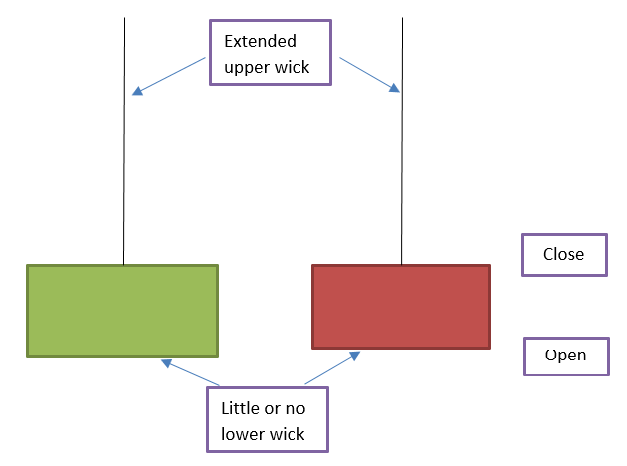
In a similar manner, inverted hammers also form close to downtrends. The upper shadow here is twice the length of the real body, which is at the lower end of the trading range. Colours of inverted hammers are not important, but a white body usually signifies higher bullish sentiment. Inverted hammers indicate that a downtrend has been in effect for some time, due to which the sentiment is bearish.
The price opens and rallies upwards, as bulls step in, but due to some reason they are unable to maintain this momentum. The existing sellers drive prices lower in the trading range. Bears stay in control, but the next day, bulls step in again to drive prices higher, without much resistance from the bears.
When prices continue to move upwards, after the formation of this pattern, the signal is confirmed.
Importance of Hammer Formations
These are highly useful indicators, which can offer plenty of information. Some advantages of hammer candlesticks are:
- They can act as leading indicators to identify shifts in bullish or bearish momentum.
- Hammers tend to be highly effective when three or more declining candles precede them. When the completed patterns emerge, they can confirm or negate that a potential significant high or low has been reached, helping traders enter and exit positions accordingly.
- The larger the shadow length, the greater is the strength of the pattern. This has to continue within an acceptable timeframe.
- Hammers are useful in indicating or confirming other reversal patterns, like tweezer formations.
- Inverted hammers can set the stage for bulls to make an entrance into the market, having established confidence levels.
Trading Hammer Candlestick Patterns
Depending on the formation of previous trends, hammer patterns can often actually be hanging man patterns or shooting stars. Typically, hanging man patterns come after a wave of buying and tend to be bearish indicators. But, hammers form after a selling wave or pullbacks. Hammers can also sometimes be confused with Doji candlesticks. Doji actually indicates indecision, since it contains both upper and lower shadows.
Traders could look for hammers to pull back towards a significant support level on the chart. When this occurs in isolation, with no support to the left, trader prefer not acting upon it. In such cases, they might wait for a day to see if a price reversal takes place.
Experts also suggest that the pattern becomes more reliable when it is greater than the trading range of prior candles over the period of the last couple of days. Volume is also an important factor to consider. If trade volume has increased from the prior session, it could indicate rising interest in the asset, at the current price level.
Limitations of Hammer Candlesticks
Ascertaining the reward potential of a trade can be tricky, since hammer candlesticks do not always indicate specific price targets. Therefore, exit strategies need to be based on other technical indicators.
There is also no guarantee that prices will continue to move upwards, after the confirmation of a hammer. Hammers with long shadows tend to signal prices being driven higher within a short period, and these are generally not a good place to enter long positions. Here, the stop-loss could be at a large distance from the entry point, which poses considerable risk.
It might be useful to include other indicators with the hammer candlestick patterns, to determine buy signals. It might also help to measure the extent of capitulation on different chart timeframes, from one-minute charts to one-month ones. The larger timeframes could provide more reliable sell-off signals, since they allow market players more time to determine the outcome of the price action.


