

Wars & Ceasefires: Trading the Uncertainty with Elliott Wave Theory

The financial markets are sensitive to geopolitical tensions like the ones arising out of the ongoing war between Russia and Ukraine, Israel and Palestine, and the tariff wars. Such conflicts give rise to uncertainties related to trade flows, supply chain systems and shortages of key resources, such as oil and gas. This, in turn, could fuel inflation and affect industrial production. Investor behaviour during these times oscillates between risk aversion and the search for opportunities. The markets often react sharply to such tensions while exhibiting familiar short-term patterns. The Elliott Wave Theory helps identify patterns indicating a specific trend.
Investor Behaviour and the Role of Elliott Wave Theory
Uncertainties related to trade, the financial stability of the affected nations and increased defence spending by some nations can negatively impact the stock, forex, commodities and other markets. During such times, risk-averse traders tend to shift away from stocks and towards safe haven assets such as gold, currencies like the USD and JPY, and bonds.
Under these conditions, the Elliot Wave theory can help identify patterns that define the potential future market moves and trading opportunities. These patterns can be confirmed by using other technical indicators, such as Fibonacci retracements, before taking positions.
Understanding the Elliott Wave Theory
Developed by Ralph Nelson Elliott in the 1930s, the Elliott Wave Theory is a popular technical analysis tool that helps predict market trends by understanding crowd psychology. The theory is based on the premise that market prices follow specific patterns driven by the collective investor behaviour, which moves from optimism to pessimism.
The theory is based on the premise that prices rise in impulsive waves when optimism is high, but as caution sets in, prices fall, indicated by corrective waves. The theory outlines an eight-wave structure that includes five impulse waves moving in the direction of the overall trend, followed by three waves moving in the opposite direction.
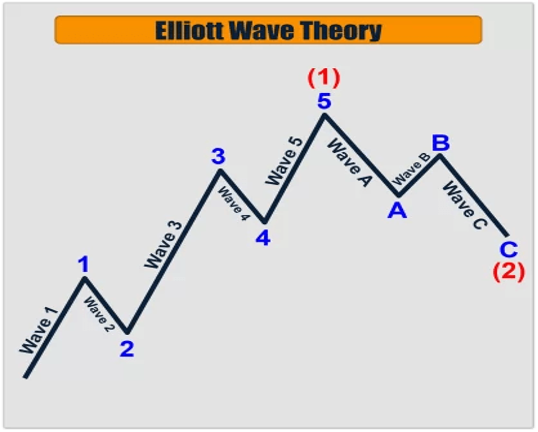
Image source: https://elliottwavemonitor.com/elliott-wave-theory/
The impulse waves include:
- Three impulses, named 1,3 and 5, with one of them (generally the fifth one) always being longer than the other two.
- Impulses 2 and 4 tend to be smaller and retrace Waves 1 and 3.
The corrective wave has three distinct price movements and includes:
- Waves A and C, which move in the direction of the main trend.
- Wave B, which moves against the main trend direction and is the shortest of the three.
The identification and use of these fractal waves help traders speculate on future price moves and determine entry and exit levels.
Identifying Elliott Waves
The Elliott Wave theory can help only if the waves are identified correctly. By identifying the nature of the wave, traders can determine whether to go long or short. Some essential considerations while identifying waves include:
- Wave 3 cannot be the shortest impulse wave and is generally extended.
- Wave 2 cannot go beyond the start of Wave 1.
- Wave 4 can never cross the same price area as the Wave 1.
- Wave 5 needs to end with momentum divergence.
If any of these rules do not hold, the structure is not an impulse wave. It is important to note that:
- Corrective or diagonal waves can look like an expanding or contracting wedge.
- Each subwave of the diagonal will never fully retrace the previous subwave.
- Subwave 3 of the diagonal may not be the shortest wave.
- It is more difficult to trade corrective impulses since they indicate market consolidation and not a clear trend.
Confirming with Fibonacci Retracements
Once the waves have been identified and labelled, the use of Fibonacci retracement levels helps determine potential support and resistance levels. This provides a better idea of the end of the corrective waves and the start of the new impulsive waves. Commonly used Fibonacci levels for trading with Elliott Waves are 38.2%, 50%, 61.8% and 100%.
To determine the point of entry and profit target, confirm that:
- Wave2 is at 50%, 61.8%, 76.4% or 85.4% of Wave 1.
- Wave 3 is typically at 161.8% of Wave 1.
- Wave 4 is at 14.6%, 23.6% or 38.2% of Wave 3.
- Wave 5 is inverse 1.236-1.618% of Wave 4, equal to Wave 1 or 61.8% of Wave 1 plus Wave 3.
Trading with Elliott Waves and Other Technical Indicators
The use of other indicators, such as moving averages and RSI, can help confirm wave patterns and take positions.
If the price of a financial instrument is moving upward on an impulse wave, traders tend to go long, but only until the completion of the fifth wave. The anticipation of a reversal after that means that traders could go short. Accurate identification of corrective waves can help traders identify tipping points of trends, when the corrective waves go over into the next impulsive wave. When a corrective wave breaks a previous low point, it signals a complete trend reversal.
Mistakes to Avoid While Trading with Elliott Waves
Accurate identification and interpretation of impulse and corrective waves are important for trading. Here are some mistakes to avoid:
- In a volatile market, traders can confuse impulsive and corrective waves. To avoid this, identify waves only if there is a clear pattern. Otherwise, choose a different technical analysis tool.
- Do not rely solely on wave patterns. Instead, confirm them by using other technical indicators, such as Fibonacci retracements and moving averages.
- Waves can indicate bullish and bearish trends. Keep your trading plans ready for both scenarios.
- Do the wave analysis in an unbiased manner to identify the real scenario rather than looking for the trend that matches your expectations.
To Sum up
- Uncertainties arising out of war and geopolitical tensions affect market sentiment, which in turn impacts asset prices.
- Market sentiment can oscillate between risk aversion and opportunity seeking.
- The Elliott Wave Theory can help identify the building up of a trend and its reversal.
- By correctly identifying impulse and corrective waves, traders can decide whether to go long or short.
- The key to the successful use of the Elliott Wave Theory is to correctly identify the patterns and then confirm them by using other technical indicators, such as Fibonacci retracements and moving averages.
Disclaimer:
All data, information and materials are published and provided “as is” solely for informational purposes only, and is not intended nor should be considered, in any way, as investment advice, recommendations, and/or suggestions for performing any actions with financial instruments. The information and opinions presented do not take into account any particular individual’s investment objectives, financial situation or needs, and hence does not constitute as an advice or a recommendation with respect to any investment product. All investors should seek advice from certified financial advisors based on their unique situation before making any investment decisions in accordance to their personal risk appetite. Blackwell Global endeavours to ensure that the information provided is complete and correct, but make no representation as to the actuality, accuracy or completeness of the information. Information, data and opinions may change without notice and Blackwell Global is not obliged to update on the changes. The opinions and views expressed are solely those of the authors and analysts and do not necessarily represent that of Blackwell Global or its management, shareholders, and affiliates. Any projections or views of the market provided may not prove to be accurate. Past performance is not necessarily an indicative of future performance. Blackwell Global assumes no liability for any loss arising directly or indirectly from use of or reliance on such information here in contained. Reproduction of this information, in whole or in part, is not permitted.

