

What are Flag Patterns on Forex Charts?

Chart patterns are valuable technical analysis tools to study price action. They are graphical representations of the forces of supply and demand, as well as the relative strength of price levels. By studying these chart patterns, traders can confirm price trends and decide on their entry and exit points.
Certain chart patterns indicate the continuation of an ongoing trend. The flag is one such continuation pattern. It signals price consolidation in a narrow range, after a sharp move upwards or downwards. Whenever a flag pattern appears on the chart, the price is expected to continue on the prevailing trend for some time.
The Structure of the Flag Pattern
There are two components of this pattern, the flagpole and the flag. Here, the flagpole is the price direction outside the pattern, while the actual flag is an area of consolidation. From there onwards, the pattern will breakout towards the previous trend, also called continuation.
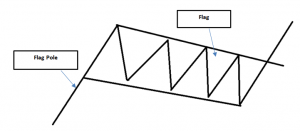
This is a figure for a bullish flag pattern. The flagpole, at both the beginning and the end of the flag, represents an impulsive momentum. The angle of this move doesn’t matter to the validity of the pattern.
After this flagpole, a valid flag pattern will form a tight consolidation range. The time period of this consolidation is irrelevant. However, the longer the consolidation, the more aggressive the breakout is likely to be. This flag runs between parallel lines, moving upwards, downwards or sideways. It is usually the sideway angles or slightly downward angle flags that are usually followed by sharp moves higher. This part is also called a rectangular channel.
After the flag pattern, the price continues to trend in the original direction. This continuation could be equidistant to the flagpole, but not always. Measuring this distance could help decide on entry and exit strategies.
Flags are widely used by long-term and swing traders, serving as indicators of potential breakouts. They provide ways to leverage a trending market.
Bearish Flag Formation
A bear flag is an inverted bull flag.
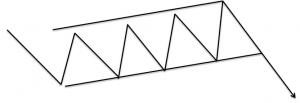
After an aggressive price move lower, the bear flag shows a slight consolidation upwards, before continuing on the previous trend. This shows greater selling power downward, rather than in the upward direction. Bear flag traders might consider waiting for the price to cross below the support barrier, before they find a place to enter a short position.
For such flags, rising volume in the flagpole and declining trade volume during the flag could be a signal for validity.
Trading the Flag
Traders can consider waiting for the initial breakout to avoid a false signal. Choppy or consolidating markets can resemble a developing flag pattern, which could be misleading.
One of the simplest things to do is trading the breakout. However, to predict a breakout direction needs expert trading skills. When the price breaks out in the same direction as the original move, the first target can be placed according to the distance between the parallel lines making the flag. For instance, say this distance is 40 pips. In that case, the profit target could be breakout price +/- 40 pips for breakout upward and downward, respectively.
Another way to set a profit target is based on the length of the flagpole. This distance can be measured right from the start of the sharp price move till the tip of the flag. If this is 40 pips long, a 40 pip target could be added to the bottom of the flag, if the breakout moves upwards. In case the breakout occurs downwards, one could subtract 40 pips from the top of the flag. The net result of the addition and subtraction could be considered as the profit target.
Setting a stop-loss is critical to protect against downside risks. One common way to do this is closing the trade immediately, when the price moves above or below the opposite side of the breakout. This usually points towards a false flag pattern. Many traders place the stop loss at the extreme swing within the flag pattern. For instance, if it is a bullish flag, the stop-loss could be under the lowest bottom in the flag pattern. For a bearish flag, the same can be applied above the highest swing in the flag.
Market Elements Usually Associated with Flags
Certain types of price action must be present in the market, which need to be quantifiable to see a flag formation.
First of all, a trending market is necessary. A substantial sharp price move upwards or downwards is required to form a flag. Secondly, presence of heavy trade volume makes the pattern more reliable. It is necessary to consider that the flag is a short-term price consolidation range, which is followed by resumption of the previous trend. High volume provides clues regarding the strength of this trend and its ability to surge directionally. Also, a high-volume bar, when the price breaks out, represents greater chances of a successful pattern.
Various timeframes are applicable to flag patterns too. Flags can be formed on tick charts in intraday trading, and even appear on weekly charts for swing traders.
Flags can look relatively easy to spot, but it does require experience to spot them in choppy market conditions. However, there are times when traders create strategies around false breakouts as well. Combined with other indicators, flags can be useful technical tools for trend traders.
Before resorting to any new strategy, consider trying them on a demo account first.


