

What are the Gann Swing Charts?
Analysing price action from chart patterns could be a difficult task. Spotting trends early on as they develop takes experience. Moreover, this analysis is subjective. Not all traders have the same technique to identify trends, leading to inconsistent decisions. This is where swing charts can help.
Swing charts remove unnecessary noise from price charts, so that the interpretation of price action becomes easier. Trends can be spotted by looking for progressively higher highs or lower lows. By using them with other technical indicators, traders can make decisions regarding stop-loss and take-profit points. One of the earliest swing chart strategies was created by William Delbert Gann, a renowned 20th century market theorist.
Gann Charts
Gann stated that markets follow mathematical rules and that there exists relationship between price and time. He devised a strategy to identify the swing ‘highs’ and ‘lows’ on the chart. There are 4 basic aspects in Gann swing charts:
- Up day– Higher high and lower low
- Down day– Lower low and lower high
- Outside day-Higher high and lower low
- Inside day– Lower high and higher low
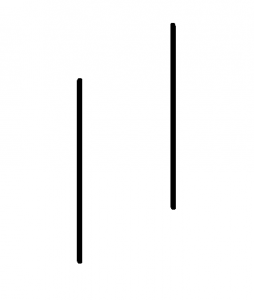
Example of bars showing higher high and lower low
A trend line indicator moves from highs to highs on each up day in an uptrend, until a reversal occurs. When that happens, it would qualify as a down day or an outside day. The trend line has to move in 3 up days consecutively, to qualify for an uptrend. Similarly, in a down trend the trend line moves from lowest lows of one down day to the next. This happens until an up day or an outside day happens.
When an outside day happens during an uptrend, and the high is reached before the low of the day, the trend indicator will go towards extreme price levels before reversing to the low of the session. In case the low is reached before the high of the day, the trend indicator will continuously move higher towards the high of the session. The trend line indicator doesn’t react to an inside day.
These market swings can be considered important indicators of true price movements. They help traders to stay objective and focused on market direction. Swing pivot-highs and pivot-lows can be used to identify support and resistance levels.
Gann swing charts can remove the element of constant time interval from price data. Each line represents an indefinite period of time; as many days as the market moves along the current trend.
Trading the Gann Swing Charts
After the chart construction, traders can identify buy and sell signals and where to put the stops.
Identifying Trends
Trends are established by progressive swings in one direction. When consecutive swing points move higher, a buy signal is generated when a swing high follows a swing bottom. Conversely, a sell signal is generated when a swing low comes right after a previous high.
Breakout traders can benefit from this system too, since it filters out a lot of noise and helps establish clear trends.
Gann 3-Period Swing Charts
Here 3-period signifies the minimum number of price bars or candles required to form a price swing. Shorter period swing charts are more reactive towards changes in the market trend. But they can also be more prone to false signals.
Here, as prices rise due to consecutive up candles, traders draw a line connecting each high. The inside candles are ignored. Down candles are also ignored, unless they form 3 consecutive patterns at a time. If that happens, the line connecting the previous swing highs now slides to connect the low of the down candles. Again, the inside candles are ignored and so are the up candles, unless they form 3 in succession.
A series of lower Gann swing lows and lower Gann swings highs, help establish a downtrend. Similarly, a series of higher Gann swing highs and higher Gann swing lows can be termed as an uptrend. A series of equal highs and lows will indicate a consolidation of trend.
Prior Gann price swings can be used as support and resistance lines for the future.
To Create Price Channels
By connective consecutive highs and lows, traders can create price channels. Price channels are chart patterns, which show the peaks and lows of an asset price over a period of time. When price oscillates between consistent high and low-price levels, traders can take buy and sell decisions.
Gann Angles
They are considered as mathematical tools to predict price movements. According to Gann’s theory, when the angle is at 45 degrees, the price and time moves in ideal momentum in respect to each other. This straight line representing 1 unit of price and 1 unit of time on a price chart is commonly known as 1×1 angles. The value of a stock which conforms to this angle is said to move higher by 1 point each day. Similarly, there are 2×1 angles and 3×1 angles and even 16×1 angles. Its not compulsory that price just moves up in these angles.
The basic premise of Gann angles is that financial markets tend to square themselves in terms of time and price. It is expected that price moves towards these angles from the highest tops and lowest bottoms.
Gann’s techniques are complicated and less used. However, his theories have been used in developing financial derivatives and many technical analysis tools.
References:
- https://www.investopedia.com/articles/technical/04/080404.asp
- https://www.investopedia.com/terms/g/gannangles.asp
- https://tradingmarkets.com/recent/a_trading_strategy_using_gann_swing_charts-677667.html
- https://www.ino.com/blog/2009/07/using-gann-swing-charts-in-futures-trading/#.XgcOhkczZPY


