

What is Tunnel Trading?

High volatility in the market can be extremely nerve-racking and can put a trader’s skills to the test. However, this is what makes trading more exciting, as volatility presents more trading opportunities. A market that is characterized by strong and frequent price movements is more attractive for intraday traders, presenting numerous options to take positions. No wonder then that most strategies focus on identifying entry and exit points when there are distinct price movements in the market.
But what happens when the market moves sideways? Intraday and day traders are often perplexed and a little frustrated when the market is quieter, either moving sluggishly in one direction or within a very narrow price range. It is during these periods that tunnel trading can help to identify entry and exit points.
How to Use a Tunnel Trading Strategy
Low volatility typically occurs when the market is waiting for important financial, economic or political news. Before the breaking of such news, traders are unsure which direction the prices might move in and to what extent. Many don’t place trades till after the market has responded to the news, while those who do place trades counteract each other, preventing large price fluctuations and resulting in the market moving sideways.
Tunnel trading is suitable for markets experiencing low volatility. When prices move sideways, it’s possible to identify a section where the prices are concentrated. This is called a congestion zone. Tunnel trading involves drawing two horizontal trendlines on the congestion zone. The upper limit of the average price movement becomes the resistance and the lower limit of the price movement becomes the support level of the tunnel. So, it’s important to have an understanding of these concepts before using a tunnel trading strategy.
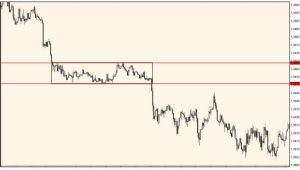
Resistance is the level beyond which the price of an asset is unlikely to rise. This, therefore, becomes a point on the pricing chart where traders expect maximum sell off. It is always above the current market price. The possibility of the price rising beyond the resistance level, absorbing the demand for selling and then falling is high.
Support is the level beyond which the price of the asset is unlikely to fall. Therefore, support levels are points on the pricing chart where traders expect maximum buyers for any asset. Whenever the price falls below the support level, they are expected to rise. This level is always below the current market price of the instrument. The possibility of prices falling up to the support level, absorbing all the demand and then rising again is high.
Wait for Breakout
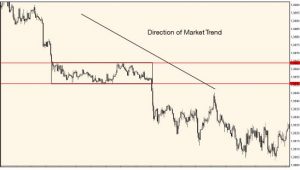
Once the tunnel has been drawn, the trader waits for the price to break out of the range. When the support or resistance level of the tunnel breaks, it indicates the beginning of volatility in prices, providing opportunities to take positions. The price may break either the upper or lower boundary, and both present an opportunity to trade. However, the indication is stronger when the breakout occurs in the direction in which the market had previously been moving (in the direction of the overall trend).
Less experienced traders may wait for the price bar to close outside the tunnel before taking a position in the direction of the breakout.
In cases where the price breaks one trendline but doesn’t close outside the tunnel, and instead moves back into the range, it would be best to refrain from opening a position. Traders may need to draw another set of trendlines if this happens.
Determining Stop Loss and Take Profit
When the breakout occurs, apart from placing positions, traders would also need to know how to set stop-loss and take-profit levels. The stop loss can be set just behind the broken boundary of the tunnel made by the breakout, a few pips away. This allows the trade some space to move, if the price returns to the broken level again. Take profit orders can be set near the support or resistance level, depending on whether you are buying or selling the asset.
Advantages of Tunnel Trading
The main advantage of tunnel trading is that it’s very simple to use. One doesn’t need to use any indicator and the strategy can be used for trading any asset and in any timeframe. Sometimes, the price becomes extremely volatile after breaking a tunnel trendline, offering more attractive trading opportunities. New traders can wait for the volatility to subside a little before opening a position.
The biggest advantage of this strategy is the risk/reward ratio. The stop-loss order is placed only a few pips from the currency market prices. So, even if a few trades turn out unprofitable, one profitable trade can more than make up for this.
Disadvantage of Tunnel Trading
Traders need to be cautious of false breakouts and possibilities of sudden whipsaws.
There are a lot of trading strategies to choose from, making it difficult for beginners to find just one that works best for them. Trading is a process of trial and error, where you need to try out many strategies to find the one that is best suited for you. Experiment, change and improve. No strategy is perfect, but tunnel trading can undoubtedly help to maximise chances of success, if used and executed properly.
http://www.matrixchartsystems.com/forex-strategies/collection-of-forex-trading-strategies/model-5

