

Trading Precious Metals in the Post-Trump-Tariff Era

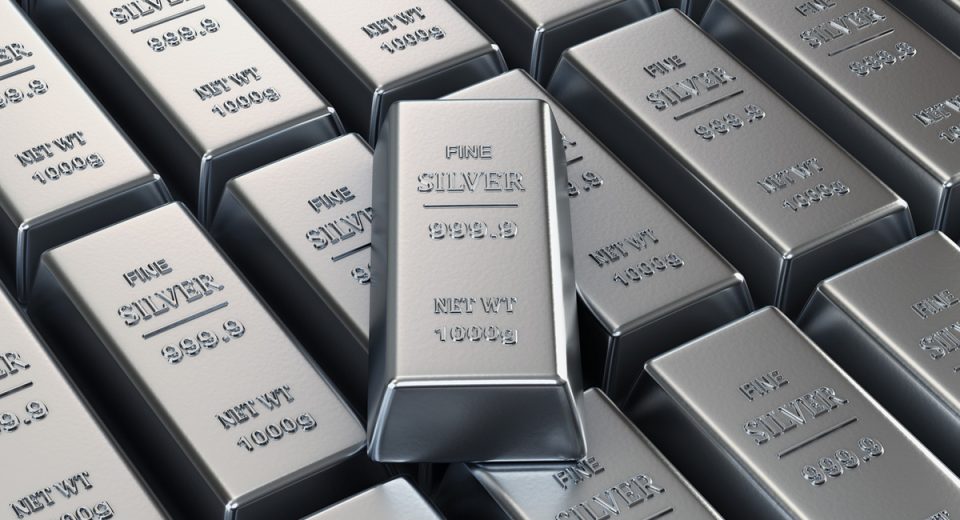
Keeping up with the latest updates on the Trump administration’s tariffs is like being on a roller coaster ride. The metals markets have felt pretty much the same. Precious metals like gold and silver generally act as a hedge during black swan events, offering stability and potential returns when the markets are volatile or uncertain. These events, characterized by extreme, unexpected impacts, often lead to a “flight to safety,” where traders seek out safe-haven assets like gold. Silver has also shown strong performance during such times.
The Trump Tariff Saga
President Trump declared April 2 as “Liberation Day,” stating that his tariff announcements made it “one of the most important days in American history” and the nation’s “declaration of economic independence.” This was the day that Trump signed an executive order imposing a minimum 10% tariff on all US imports. Unfortunately, that was only the beginning of the story.
On April 9, the US president added tariffs on imports from numerous countries, including 104% duties on imports from China. This led China to retaliate with 84% tariffs on US goods. Later that day, President Trump put a 90-day pause on his tariffs but raised import duties to 125% for China. He changed his mind in less than 24 hours and raised China’s tariffs to 145% on April 10.
The Red Dragon didn’t want to be outdone. So, Beijing announced 125% tariffs on US imports on April 11. The one-upmanship game continued with the White House announcing that China was now likely to face tariffs of up to 245%.
For now, gold, silver and copper are exempt from tariffs. This is fortunate, given how critical these metals are to central bank reserves, financial market stability and industrial output. The exemption could prove helpful in stabilising the precious metals markets by safeguarding the supply chains amid broader trade disruptions.
Impact on the Precious Metals Markets
Gold rose to a new high of $3,357.40 on April 16, driven by investor concerns regarding the impact of the US-China tariff war. Gold traded above the $3,000 mark for the next week, rising 25.67% YTD by April 23. Comments by Fed Chair Jerome Powell regarding the US president’s tariff policies likely leading to slower economic growth, rising unemployment and higher prices led investors to seek out the safe-haven metal.
The huge “reciprocal” tariffs are likely to continue to impact the metals markets well into 2026, especially hurting the prices of industrial metals like silver but keeping gold prices up due to tariff-led inflation fears. The US dollar, another safe haven, has also been under pressure with the tariff to-and-fro. The US Dollar Index fell 0.49% to 102.449 after the first round of tariff announcements by President Trump. With the tariff war continuing, the index had declined 8.67% YTD by April 23. If investors believe they cannot rely on the USD as a safe haven, they will likely focus on gold to hedge their portfolios against stock and metals market whiplashes.
Another metal to consider is copper. An essential component of consumer electronics, AI chips, electric vehicles., renewable energy systems, and even construction, the demand for copper is unlikely to wane anytime soon. Some analysts have gone so far as to predict that the red metal’s price could cross the $12,000 per metric tonne mark in 2025. The forecast doesn’t appear too optimistic given that the price was closing in on the $10,000 mark in April. Plus, the IEA expects a potential supply gap of 4.5 million metric tonnes by 2030, if the aggressive clean energy goals are to be met.
With all three metals exempted from the tariff war, the price uptrends could persist into 2026.
What Does This Mean for Metals Trading?
With the potential of tariffs disrupting supply chains and trade patterns, economic uncertainties are likely to increase worldwide. In addition, a rise in import costs could put inflationary pressure on several countries. Trade tensions often result in currency volatility, which could lead traders to safeguard their portfolios against forex risks.
Therefore, experienced traders are reevaluating their portfolios to check the allocation of precious metals as a hedge against market and economic uncertainties. This not only includes CFDs on metals but also mining stocks and ETFs. Physical holdings of precious metals also need a relook, especially given the storage costs.
The time now is to look at both current price fluctuations, as well as your long-term metals trading strategy. Historical price data shows that during times of economic policy changes, gold typically outperforms due to its safe-haven status. Silver, on the other hand, is not just a store of value but also has industrial applications. This leads to a more complex response pattern for the metal. During the US-China trade war of Trump’s previous term in office, gold prices rose about 18.3% in 2019, while silver was up 15.2%.
Therefore, looking at the gold-to-silver ratio can prove useful in determining market sentiment and identifying opportunities for trading. Also, while making trading decisions, it is important to keep your long-term trading goals and risk tolerance in mind.
To Sum Up
- Traders tend to gravitate to safe-haven assets during black swan events like the ongoing Trump tariff war.
- Although President Trump has paused tariffs on other nations for 90 days, duties on Chinese imports have been raised to up to 245%.
- China has been retaliating by raising counter-tariffs on US goods.
- Precious metals, gold and silver, and copper have been exempted from the tariffs so far.
- The tariff announcements led to gold prices touching new highs.
- Historical data shows that during periods of policy change, precious metal prices tend to rise.
- Experienced traders tend to reevaluate their portfolios during such times.
- It is important to keep your long-term trading goals and risk tolerance in mind while increasing your exposure to precious metals during times of uncertainty.
Disclaimer:
All data, information and materials are published and provided “as is” solely for informational purposes only, and is not intended nor should be considered, in any way, as investment advice, recommendations, and/or suggestions for performing any actions with financial instruments. The information and opinions presented do not take into account any particular individual’s investment objectives, financial situation or needs, and hence does not constitute as an advice or a recommendation with respect to any investment product. All investors should seek advice from certified financial advisors based on their unique situation before making any investment decisions in accordance to their personal risk appetite. Blackwell Global endeavours to ensure that the information provided is complete and correct, but make no representation as to the actuality, accuracy or completeness of the information. Information, data and opinions may change without notice and Blackwell Global is not obliged to update on the changes. The opinions and views expressed are solely those of the authors and analysts and do not necessarily represent that of Blackwell Global or its management, shareholders, and affiliates. Any projections or views of the market provided may not prove to be accurate. Past performance is not necessarily an indicative of future performance. Blackwell Global assumes no liability for any loss arising directly or indirectly from use of or reliance on such information here in contained. Reproduction of this information, in whole or in part, is not permitted.
