

5 Doji Candlestick Patterns
Price charts are powerful tools for forex traders. Thanks to advancements in trading technologies, traders have various ways to study these charts to understand price action and locate patterns. Platforms like MT4 allow traders to open multiple charts at once. Candlesticks are popular ways to study such charts. They provide a range of information about price movements, with their shapes leading to opinions regarding trends, entry/exit decisions and stop-loss points.
A specific type of candlestick is the Doji candlestick, which shows market indecision. It is often considered to be an indicator of a potential change in market direction. These candlesticks are easy to locate, and their wicks can guide traders as to where stop-losses can be placed.
Let’s understand more about them through their 5 variations.
What is a Doji Candlestick? How is it Traded?
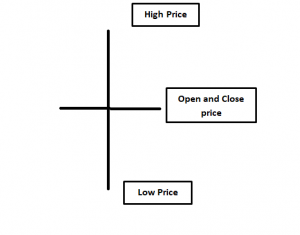
Before moving on to their types, let’s understand how to identify them. A Doji candlestick appears like a cross or plus sign. These are neutral patterns, where the wicks show that open and close prices for a timeframe period were practically the same. Their appearance could mean a potential reversal in trends in the near future.
“Doji” in Japanese means mistake, referring to how rare such patterns can be. The prices may have moved between the open and close levels of the candle, but the market was indecisive about where to take the currency pair (up or down). This led to no dominant directional force on the price. While such situations and the Doji are rare, when they do appear, they are either on the top of a retracement in the downtrend or below a retracement in an uptrend.
At such times, traders can consider trading the Doji in the direction of the trend. The stop-loss can be placed below the lower wick in an uptrend or above the upper wick in a downtrend.
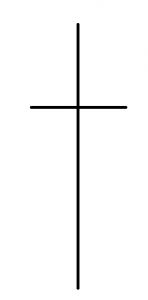
The figure below shows a standard Doji. Depending on where the open and close prices are, the Doji can have some variations.
1. Standard Doji Pattern/Doji Star
The standard Doji candlestick does not mean anything on its own, so traders place them in the context of an ongoing price trend. This pattern forms when buying and selling activities are in equilibrium, but the prior trend needs to be considered too. If the candlestick forms within an uptrend, it could indicate a likely change in market direction. A strong bullish candlestick formation prior to the Doji is considered to indicate a significant uptrend. If a bearish candlestick is formed below the Doji’s low (and it has a lower high than the Doji’s high), then traders consider it to be a sell signal. The opposite is applicable for a buy scenario. A strong downtrend can be followed by a Doji formation, to be followed by a bullish candlestick above the Doji high.
2. Long-Legged Doji Pattern
This pattern is marked by longer wicks than the standard Doji candlestick. This means that at some point during the pattern formation, both buyers and sellers tried to dominate, but there was no real winner when the candle closed. Traders here focus on the closing price, in relation to the mid-point (50% of the candlestick length).
- If the closing price is below the mid-point, it can resemble a bearish pin-bar. It becomes important if it appears at the resistance levels.
- If the closing price is above the mid-point, it can resemble a bullish pin-bar. If this forms at the support levels, it could be a valid indicator of an uptrend.
3. Dragonfly Doji Pattern
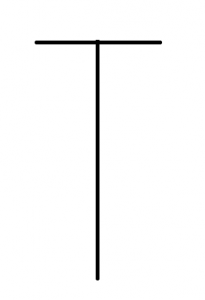
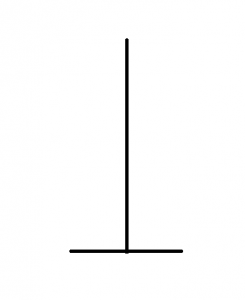
A Dragonfly Doji has a longer lower wick and signifies that the open, close and highest price were at the same level. Consider it like a ‘T’ shaped candlestick.
If it forms at the bottom of a bearish move, it can be considered a bullish signal. Confirmation is strong when that happens on a support level. Traders can consider going long on the breakout of the high of the Doji pattern.
4. Gravestone Doji Pattern
This pattern can be considered the opposite of the Dragonfly. Here, the open and close prices remain at the lower end of the trading range. It shows that the buyers were able to push the prices up but failed to sustain this bullish momentum when the candle closed. When the Gravestone Doji forms in an uptrend, it can be considered a bearish reversal pattern, especially if it forms at the resistance level or Fibonacci retracement level. Here, it could resemble a shooting star candlestick, except that it barely has a candlestick body. Similarly, for it to be a bullish reversal signal it has to appear in a downtrend, on a support level. The long upper wick is an important feature of the Gravestone Doji, since it means that price levels went up to touch the resistance level and bounced back down.
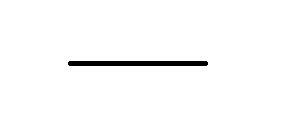
5. Four Price Doji Pattern
This is characterised by a simple horizontal line, with no vertical line above or below it. It means that all the four prices, high, low, open and close, were at the same level. It signifies an extremely quiet market, one where prices didn’t move at all. In the highly liquid forex market, such patterns are extremely rare, but this often occurs in the stock market. A four price Doji usually means complete market indecision and is, therefore, not very important in the context of trading signals.
Traders need to consider that Doji candlesticks are good reversal indicators, when they appear in the middle of over-extended rallies or oversold dumps. If they are found in early stages of a trend, the chances of a reversal are lower. Also, they are considered only if they are formed in trending conditions, since ranging conditions typically mean indecision. If the market is seeing a continuation of the previous trend, after the Doji pattern forms, it could indicate a fake reversal pattern. This could be considered an opportunity to add on to a previously long trade.
All the variations of the Doji are based on the same theme. They are either continuation or reversal patterns. With more practice, you will be able to identify them easily and make informed decisions.
Reference Links
- https://www.investopedia.com/terms/d/doji.asp
- https://forextradingstrategies4u.com/doji-candlestick-patterns/
- https://finance.yahoo.com/news/understanding-doji-candlestick-pattern-technical-201056948.html

