Technical Indicators
Learn how to apply indicators such as RSI, MACD, and moving averages to support trade decisions.
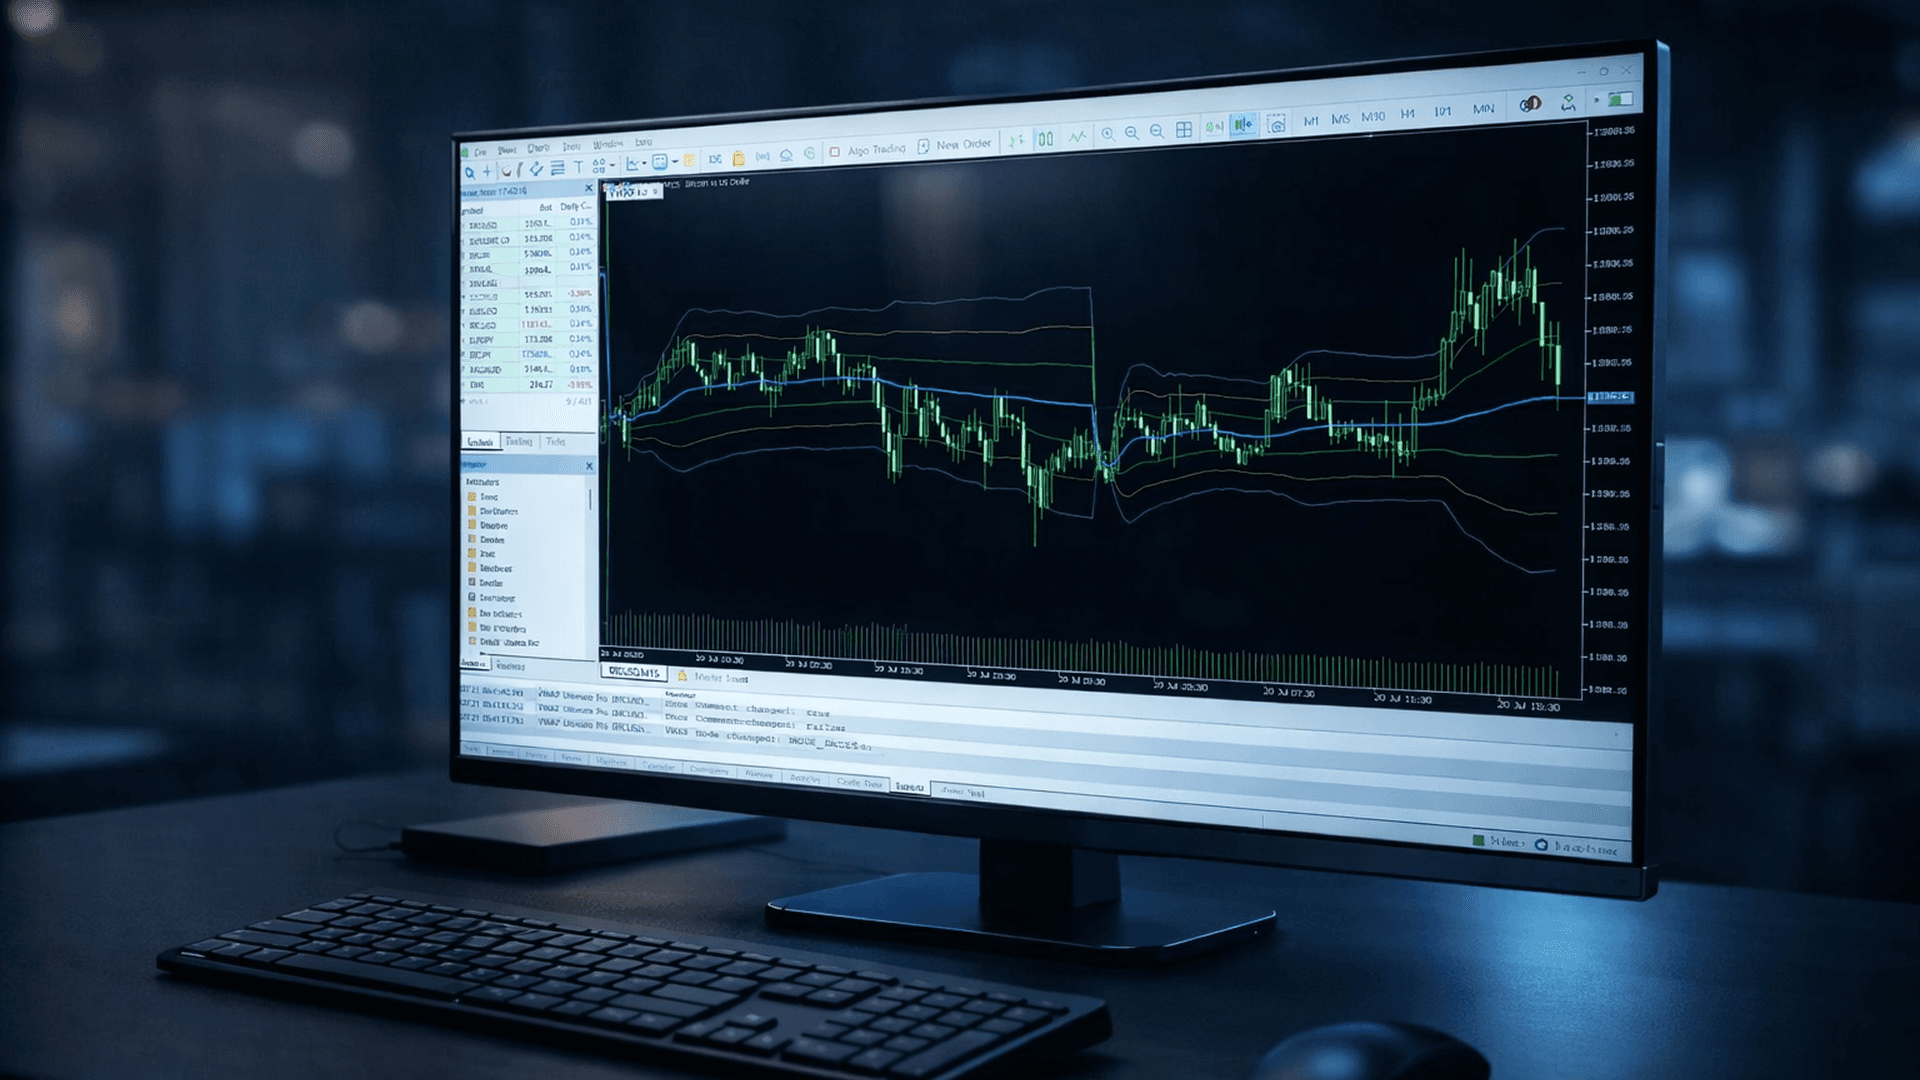
Easy Guide to the VWAP Technical Indicator
The Volume Weighted Average Price (VWAP) is a powerful intraday indicator that combines price and volume to reveal the true average price of an asset. Widely used by traders and institutions, VWAP helps identify trends, key levels, and optimal entry and exit points.
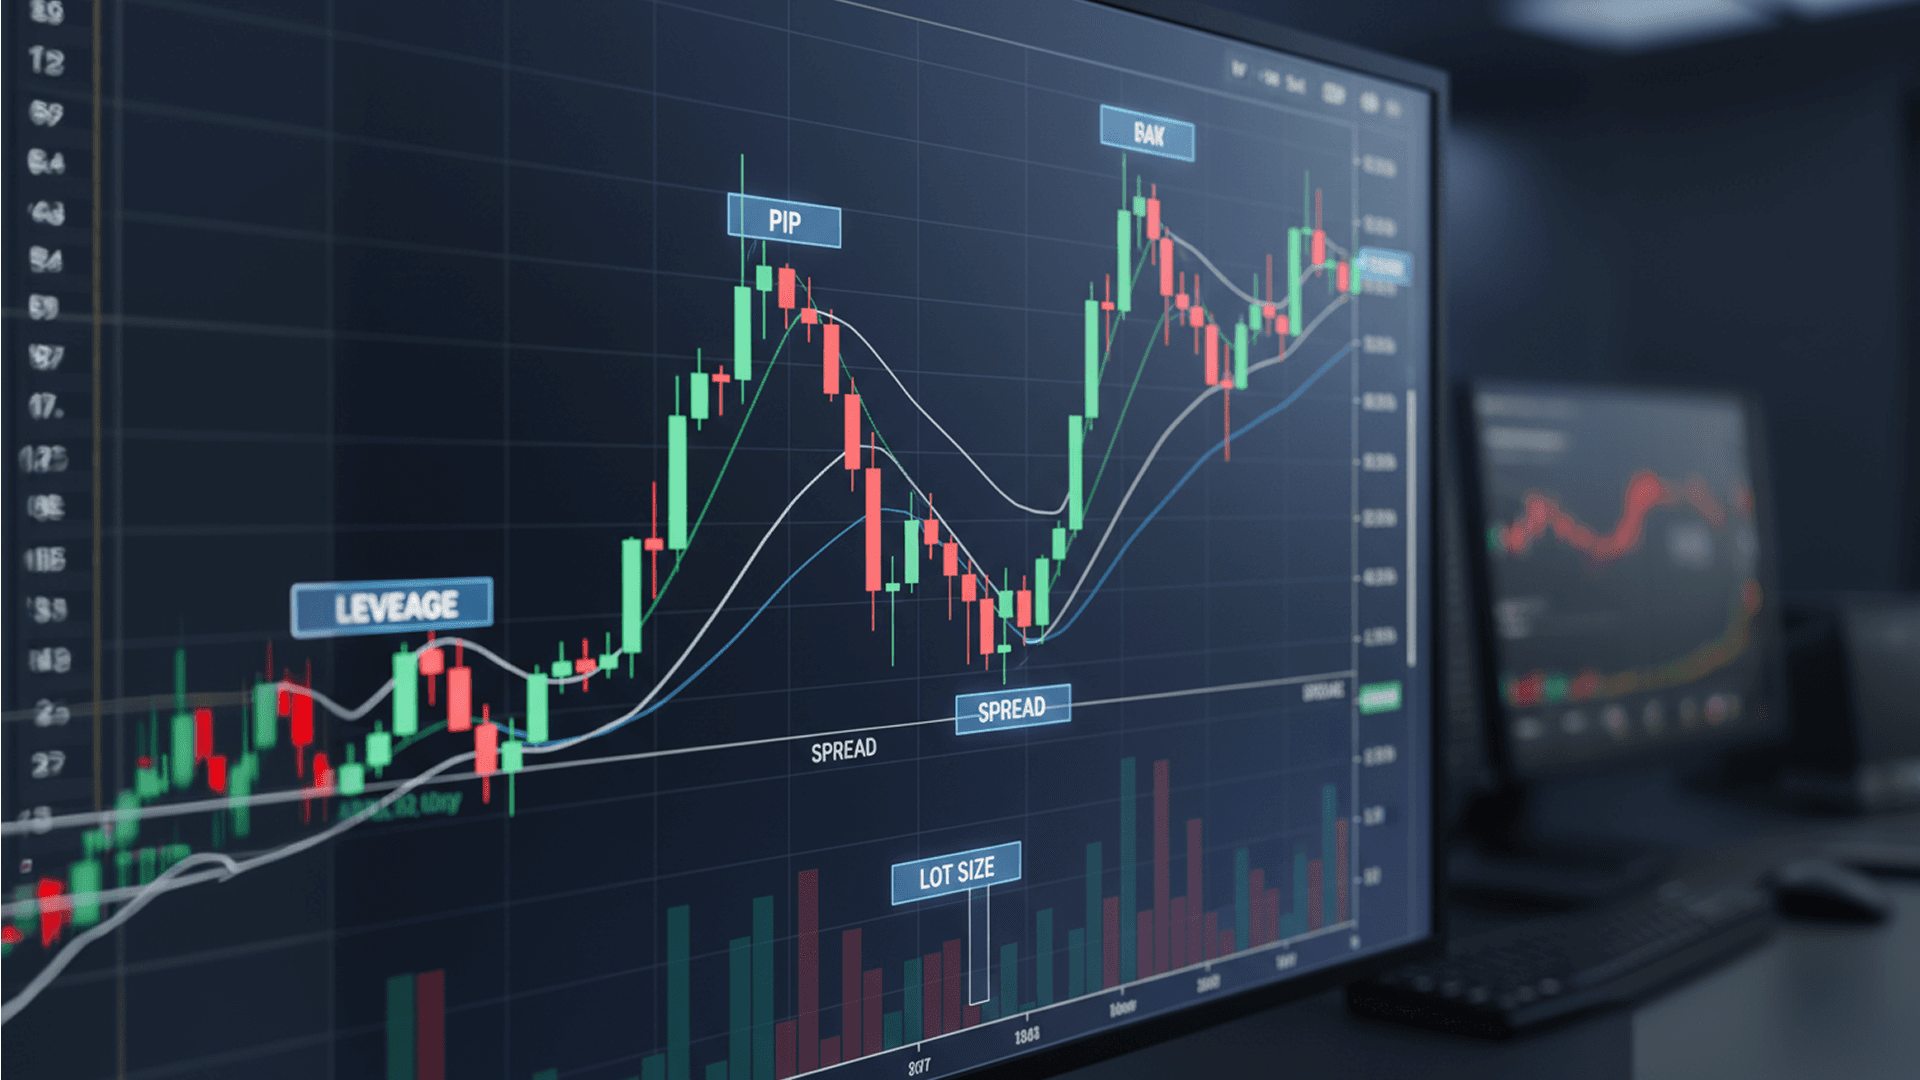
25 Forex Trading Terms Every Trader Should Know
Learn 25 essential forex trading terms every trader should know, from basic concepts like base currency and liquidity to advanced ideas like arbitrage and slippage, to trade smarter and understand the market with confidence.
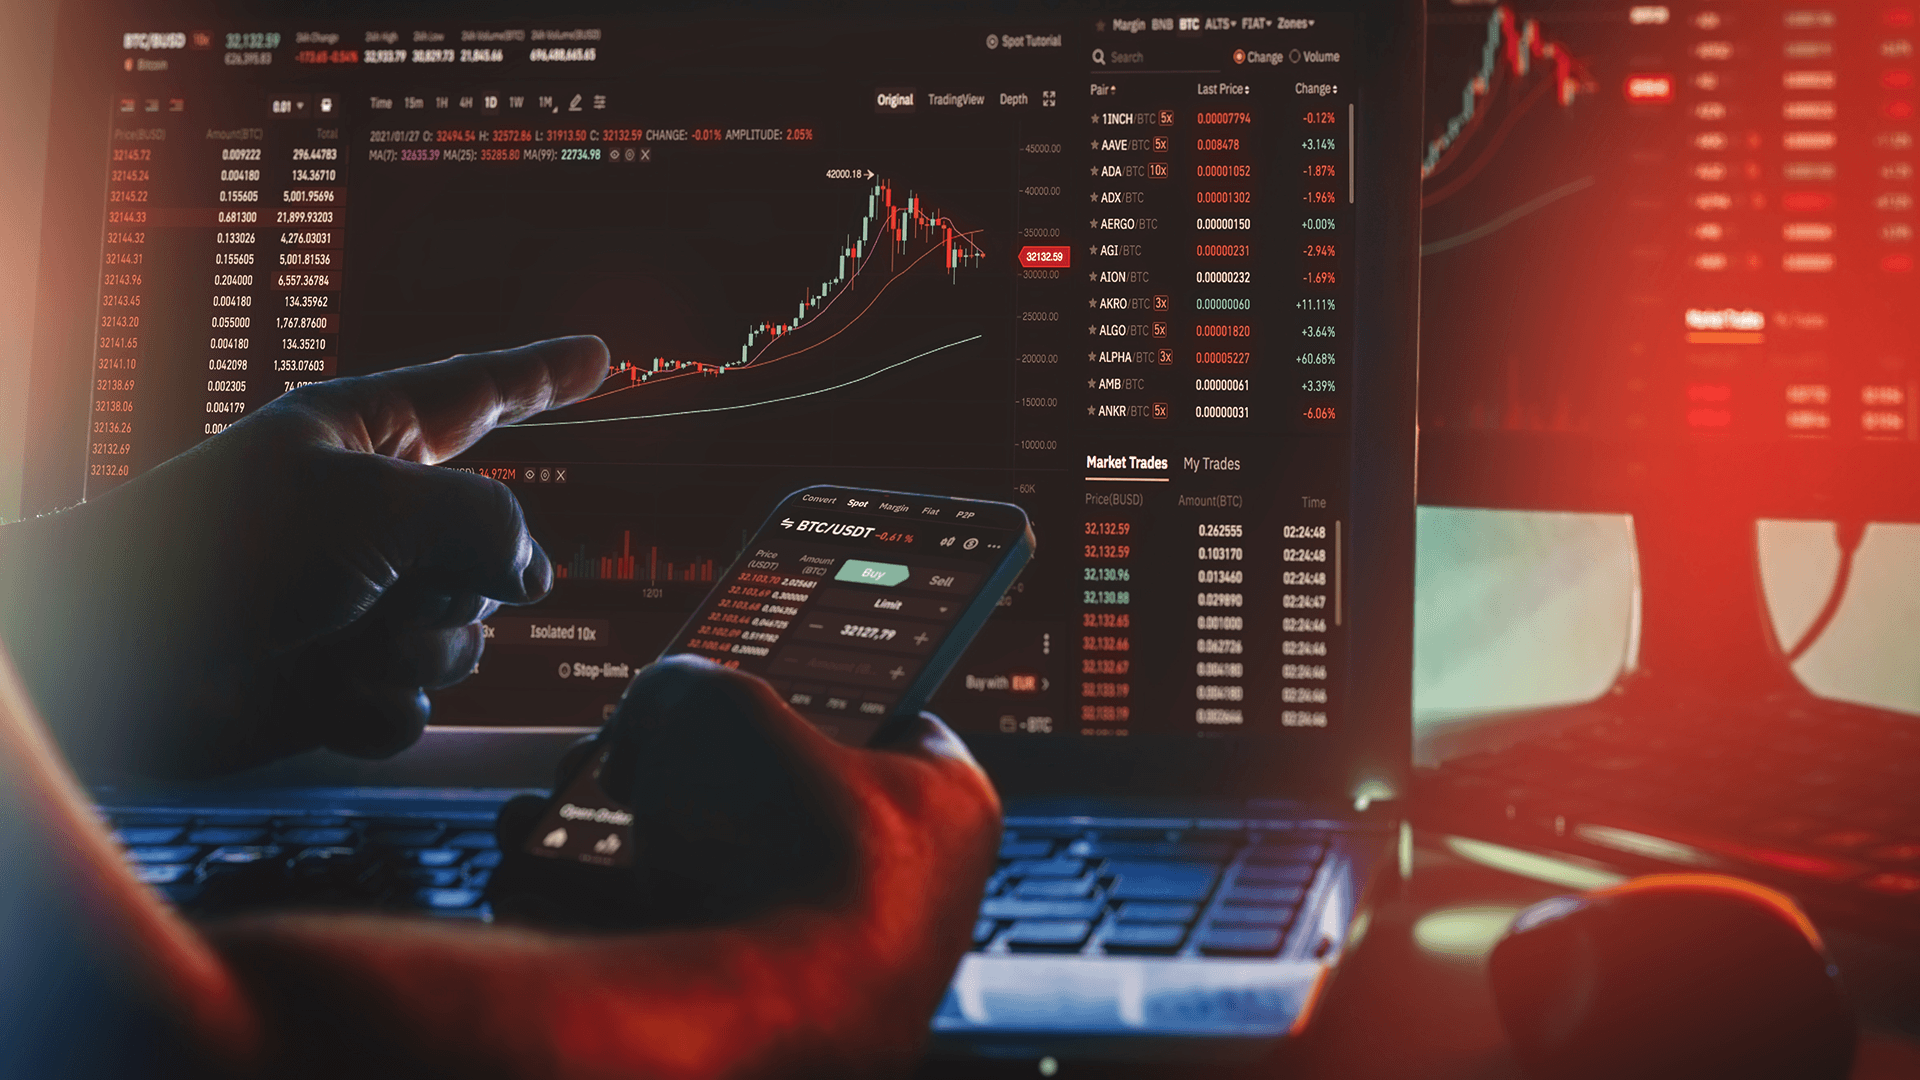
Why Traders Need to Know About Leading and Lagging Indicators
Understanding the difference between leading and lagging indicators is essential for effective technical analysis. This article explains how each works, their strengths and limitations, and how combining both can improve trading accuracy and timing.
How to Trade the 3 White Soldiers
The Three White Soldiers is a powerful bullish reversal pattern that signals a shift from selling pressure to strong buying momentum. This article explains how to identify, confirm, and trade the pattern effectively, along with its advantages and limitations.
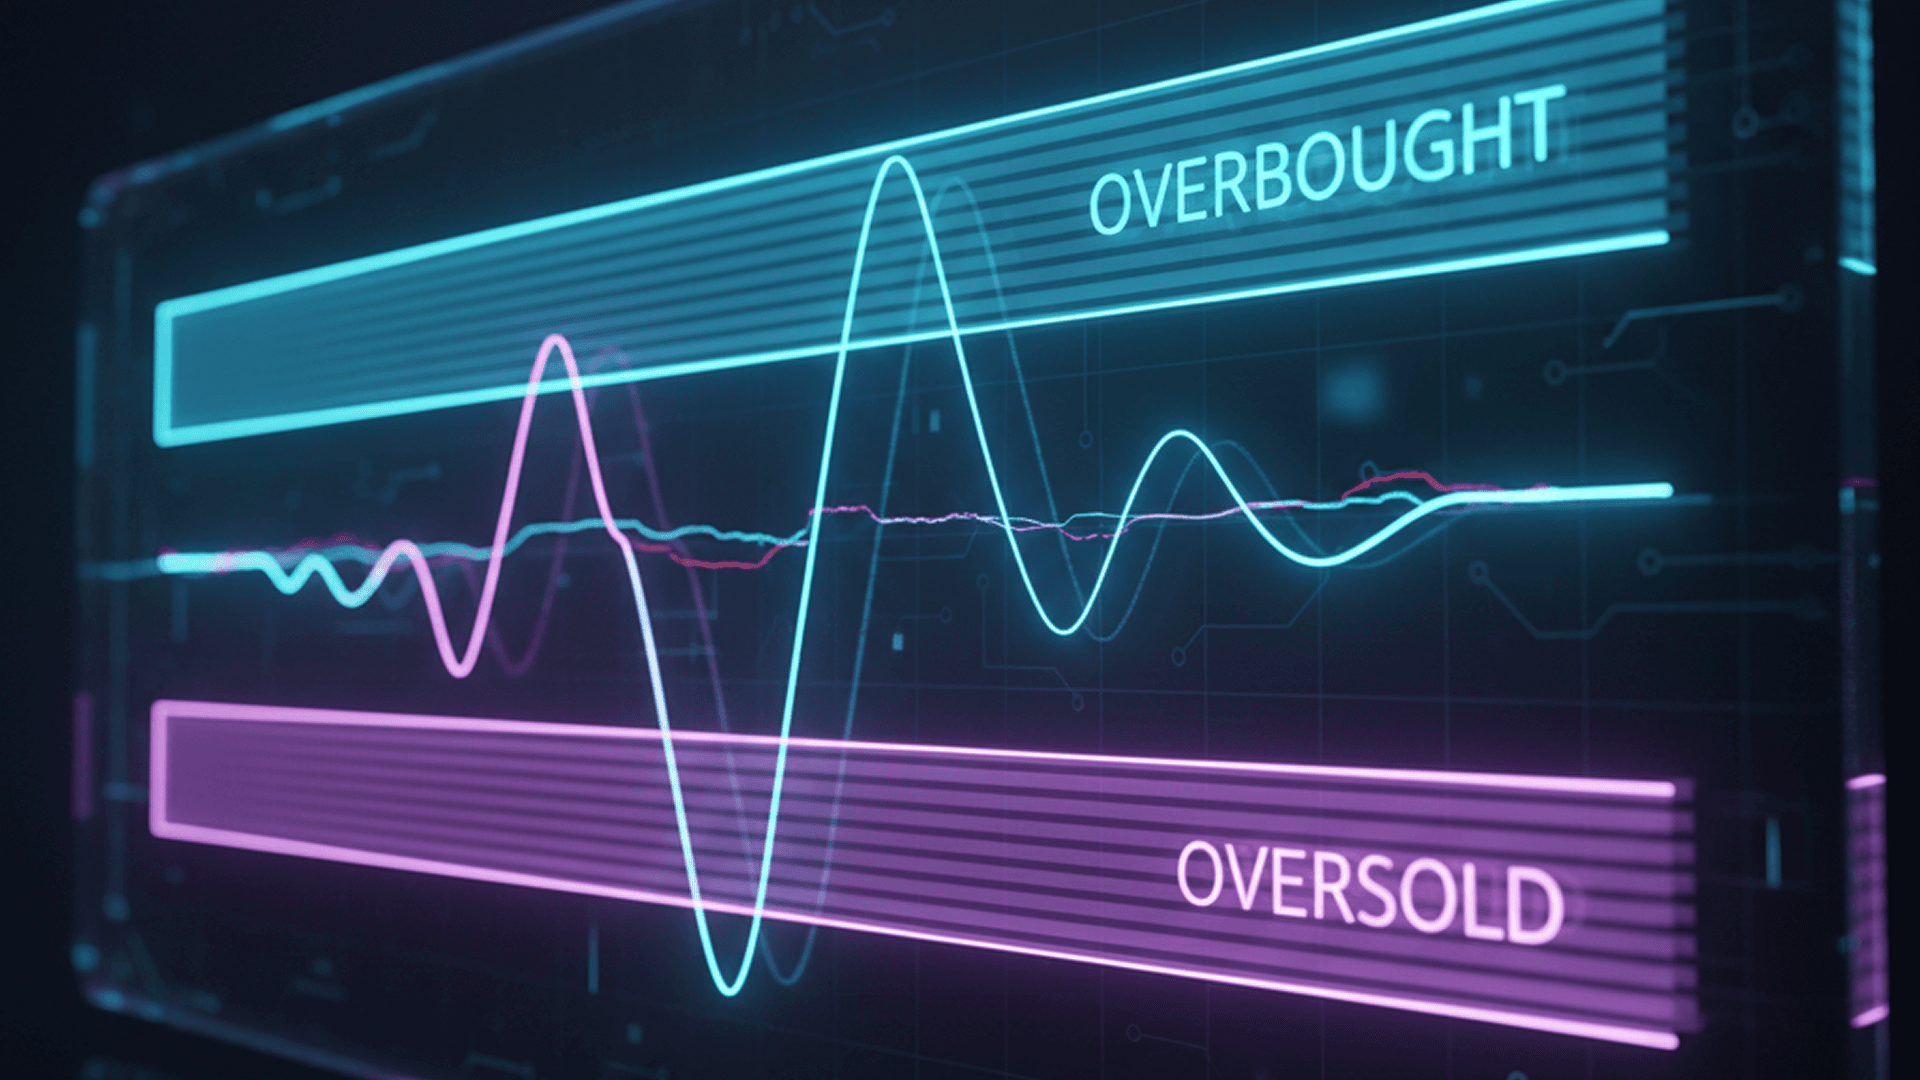
How to Use the De-Marker Indicator (DeM) in Trading
The DeMarker (DeM) indicator is a leading oscillator that helps traders identify potential market tops, bottoms, and shifts in momentum. This article explains how DeM works, how to interpret its signals, and how to combine it with other tools for more reliable trading decisions.
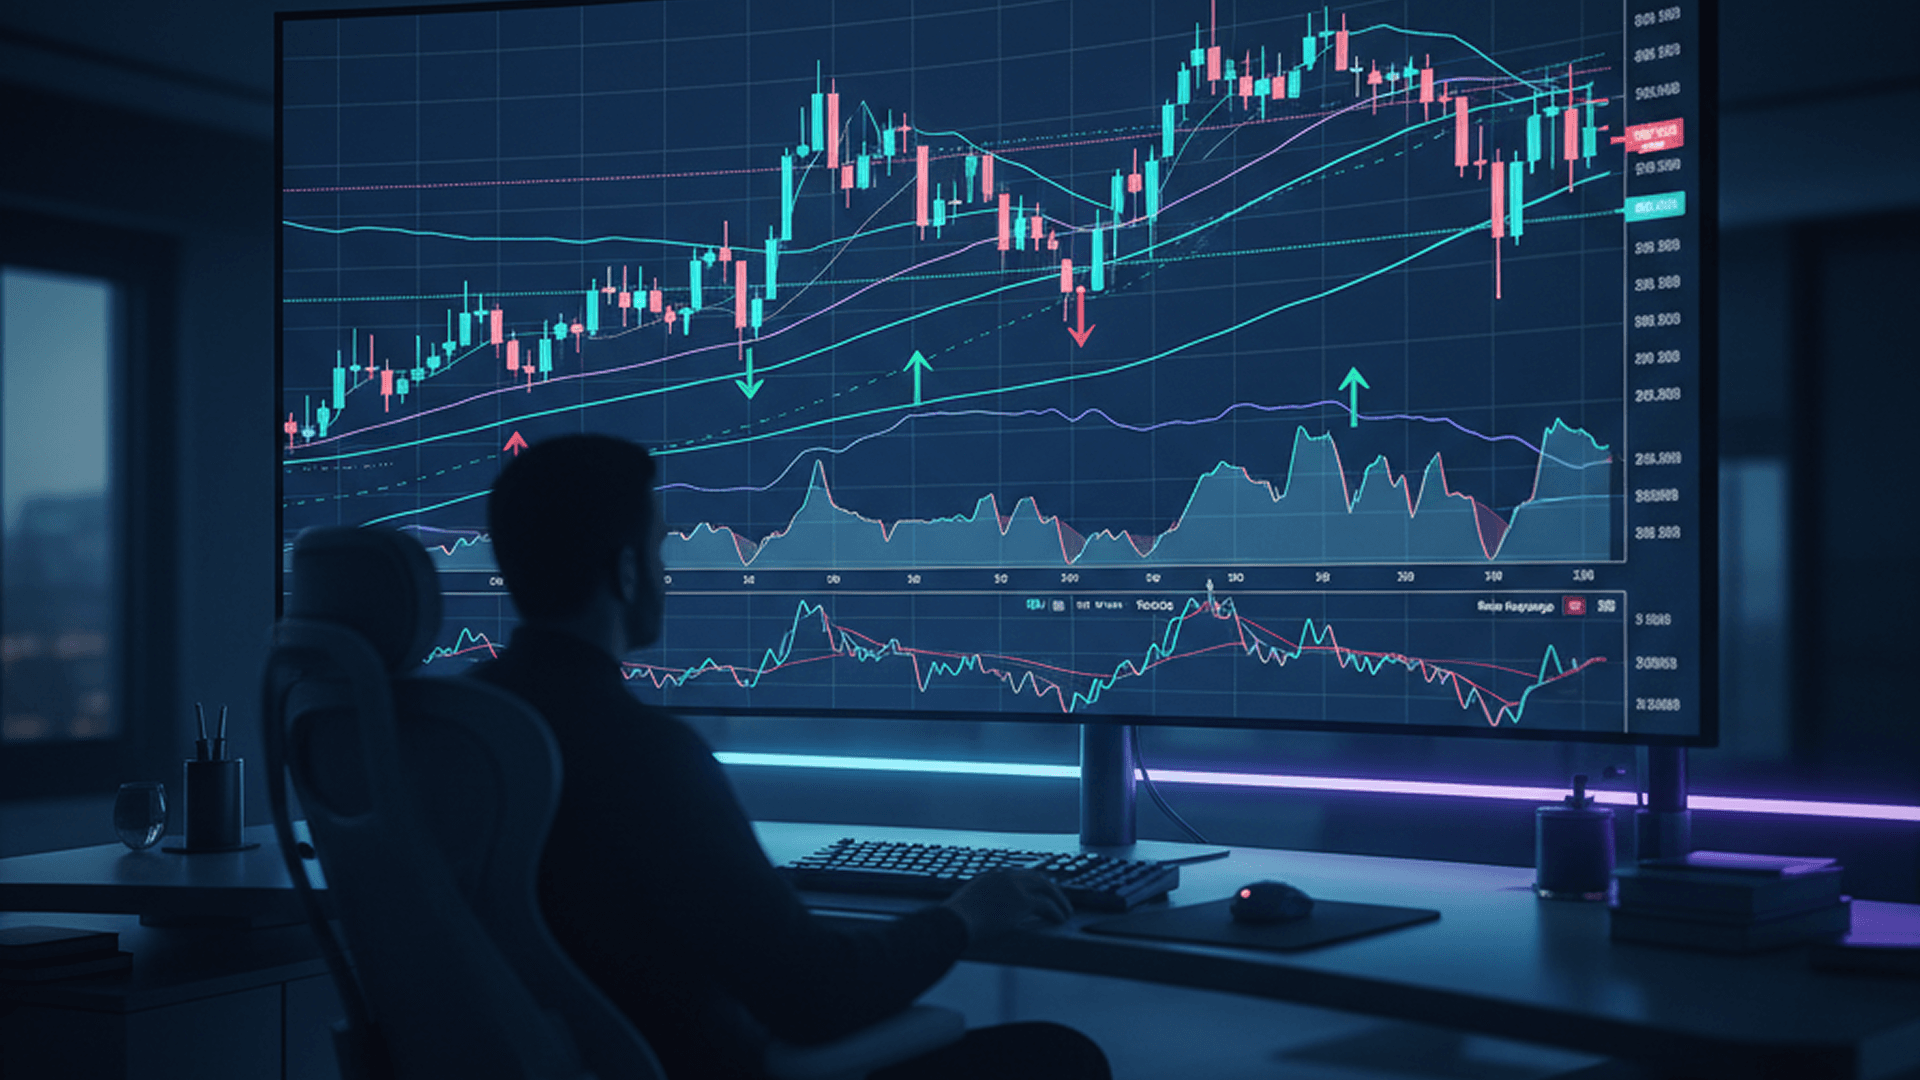
Most Popular Technical Indicators for Swing Trading
Swing trading focuses on capturing short- to medium-term price movements by identifying market highs and lows. This article explores key technical indicators, like MA, RSI, Stochastic, and EOM, that help traders analyze trends, momentum, and volume for better entry and exit decisions.

How the VIX Helps Traders Navigate Market Uncertainties
The VIX, often called the “fear index,” measures expected market volatility and reflects investor sentiment. This article explains how the VIX works, what its levels indicate, and how traders use it to hedge risk or capitalize on market uncertainty.
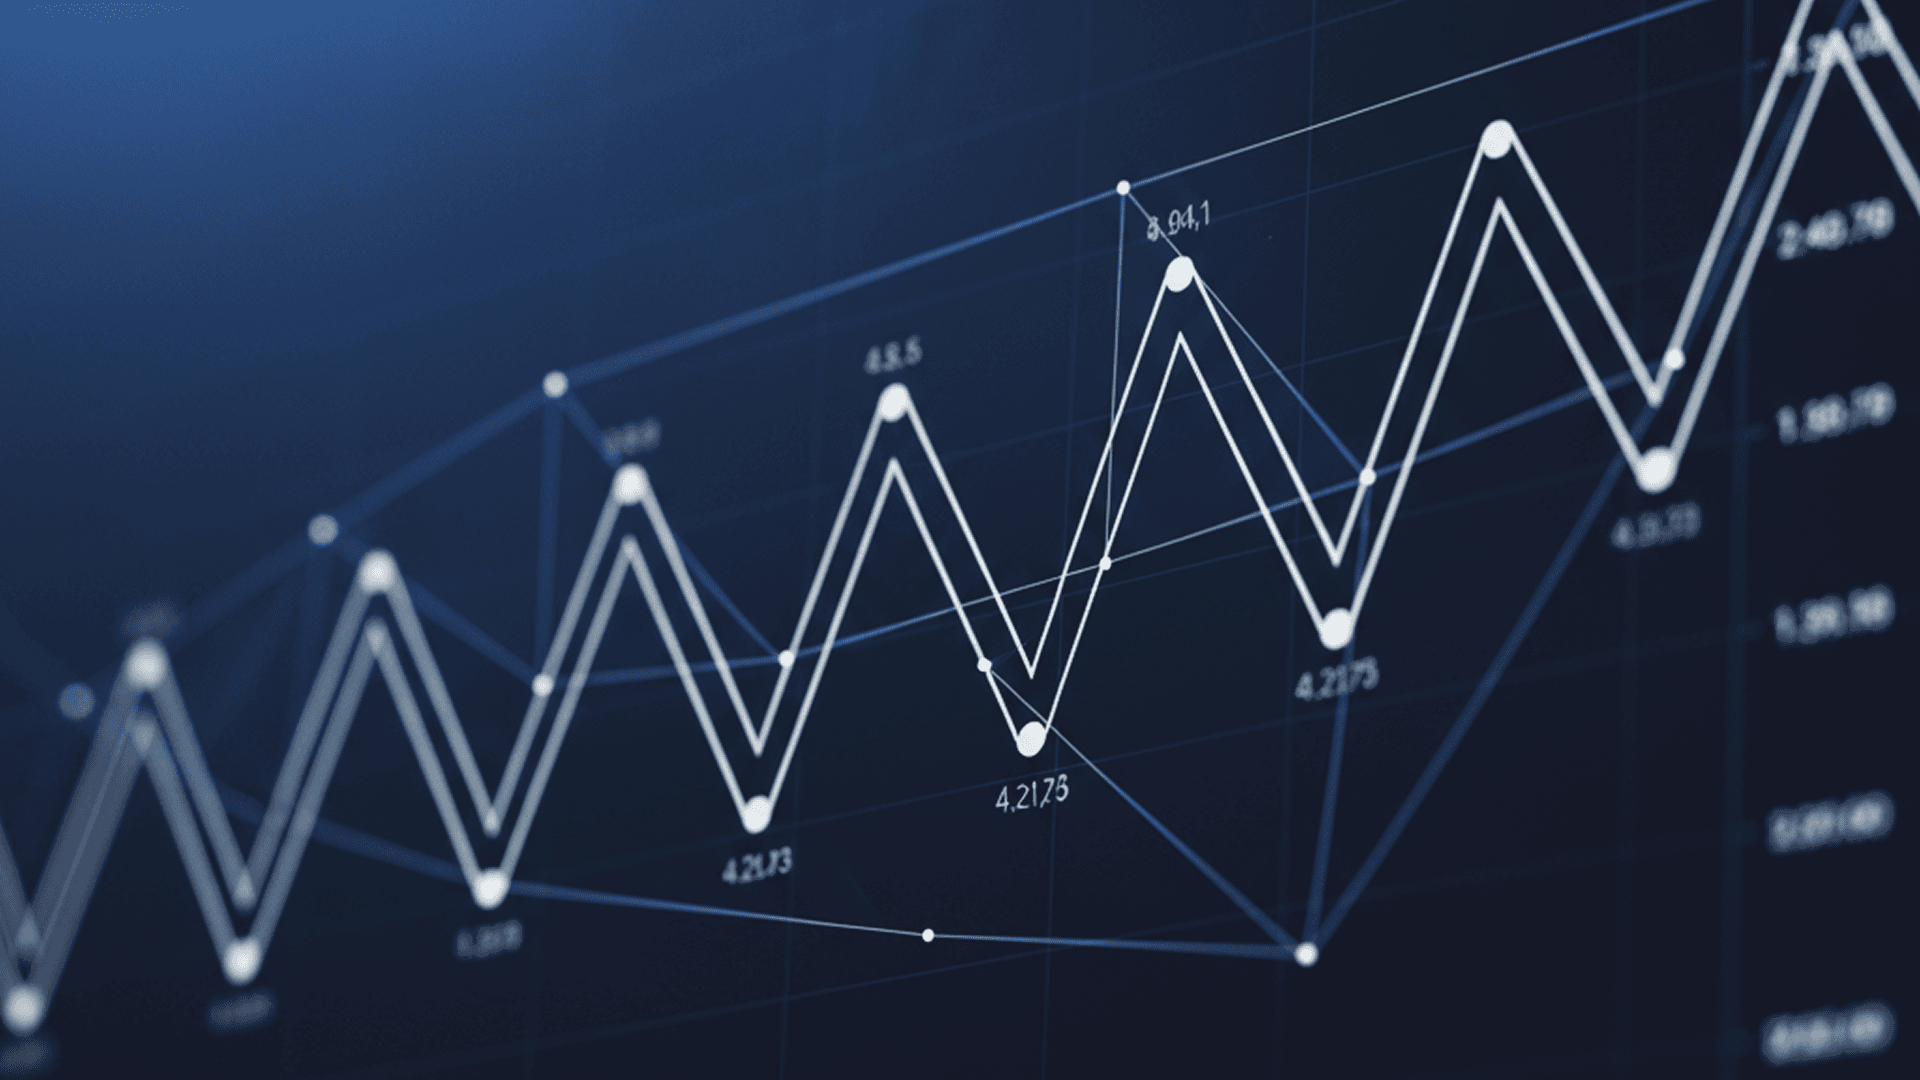
What are the Gann Swing Charts in Trading?
Gann Swing Charts help traders filter out market noise and focus on true price movements by identifying swing highs and lows. This article explains how the method works, how trends are formed, and how traders can use it to improve entry, exit, and risk management decisions.

Your trading starts here
Open an account and start trading in minutes, or practise first with a risk-free demo.