

Know about the Tweezer Candlestick Pattern
Candlestick patterns are useful technical analysis tools, which can help traders predict specific market movements. There are 42 recognised, simple and complex, candlestick patterns, one of which is the Tweezer candlestick formation. One of the most powerful predictive patterns, Tweezers always involves two candles. These consecutive candles have equal or approximately equal highs (Tweezer tops) and lows (Tweezer bottoms).
According to Steve Nison’s book, Japanese Candlestick Charting Techniques, Tweezers can have many appearances on the chart, but they are usually formed at market turning points. They can signal a significant shift in the direction of a trend. But a larger context might be needed to identify such signals, since these formations appear quite frequently.
How Does the Tweezer Pattern Look?
This is the only candlestick pattern, where the highs and lows are much more important than the body or shape of the candle. Tweezer tops occur in an uptrend and tend to have more or less the same highs. Tweezer bottoms occur in a downtrend and the lows are equivalent. The two candlesticks should have alternating colours, where the first one indicates the current trend and the second one shows trend weakness. They indicate that once the market has reached a desired price level, there is a shift in control between bulls and bears.
Tweezer Top – For Bearish Reversal
Here, the first candlestick occurs in an uptrend and closes near to its high. This high becomes the high of the next candlestick, which then moves bearishly downwards. The pattern is more reliable when the first candle has a large real body, and the second one has a short body.
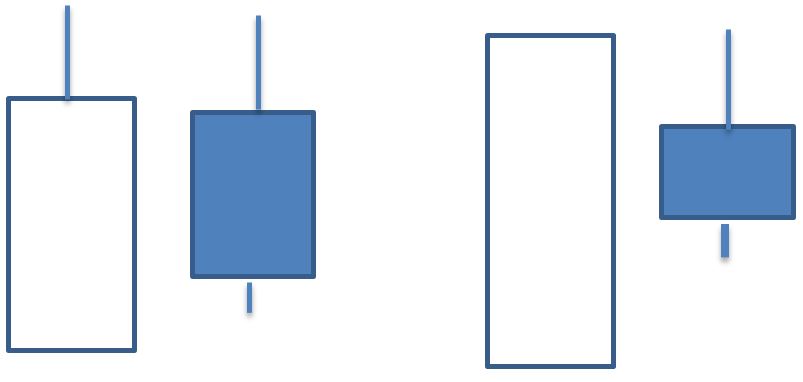
The pattern is more reliable if studied with respect to the broader price charts, with the pattern appearing either at resistance and trend lines or near market highs.
Tweezer Bottom – For Bullish Reversal
The initial bearish candlestick continues on a downtrend, closing near a new price low. This low becomes the low of the next candlestick, which then moves towards a bullish uptrend. Here too, a larger real body in the initial candlestick is considered a reliable signal.
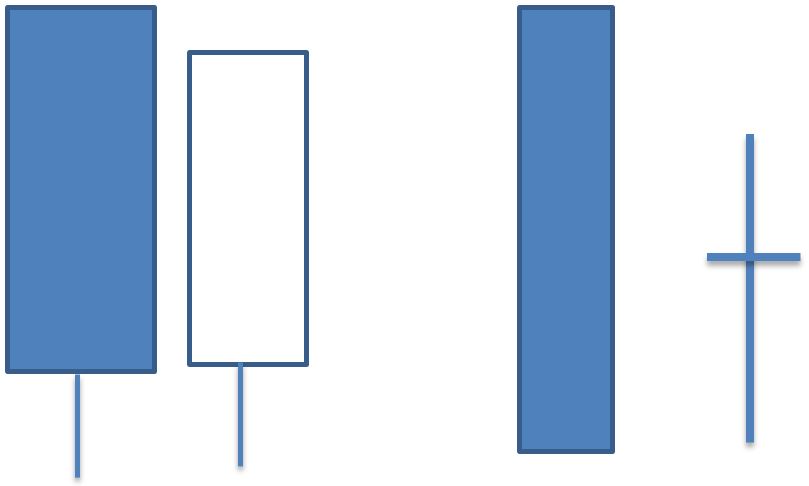
This pattern becomes more reliable when seen near market lows, or near lower trend lines or support levels. If you see the second figure above, you can see that the second candlestick can be of any shape, which in this case in a Doji neutral candlestick pattern. As long as the lows are similar, the sizes and appearances don’t matter.
Importance of Tweezer Formations
Tweezers are topping and bottoming patterns, which makes them useful to predict trend reversals. The first candlestick shows a strong price move in the current direction, while the second one stalls or even reverses this previous price action. Completed tweezers further confirm significant highs and lows in price levels.
These patterns are similar to short-term double bottom or double top. This shows that prices held twice at the same levels. In the bottom, sellers were unable to push asset prices further down. At the top, buyers were unable to drive the price upwards. Hence, these patterns can point towards significant short-term support and resistance levels.
They can occur on two consecutive trading sessions, which is where they become easier to spot. Here, the predictive powers are stronger because such cases typically mean a pause in the bullish or bearish trend, leading to a significant trend reversal. In certain cases, the patterns will form six or seven sessions apart, in which case they point towards future support and resistance levels.
Like any other candle formation, traders need to look into the immediate price action, following the formation of these patterns. For instance, for a Tweezer bottom to be a reliable trend reversal indicator, the low formed by two candles should hold for some time. Beyond this, the prices can reach the next best support level. The same is true for Tweezer tops. Summarising the importance of Tweezers candles:
- They are leading indicators, signalling a short-term price swing or trend reversal
- They are helpful in confirming other reversal indicators
- Incomplete Tweezers can also say a lot about price movements
- They are useful in identifying support and resistance levels
- They could be used to spot good entry and exit points.
Using Tweezer Formations to Place Trades
These patterns occur frequently on trading charts, which is why traders often resort to using other analytical tools to confirm their signals. With an existing overall trend, Tweezers occurring in times of pullbacks could serve as good entry points. This is an indication of the end of the pullback and that the price might move in the direction of the next trend. Here, the presence of an overall trend is important, since it carries greater potential for a reward, paving the way for a favourable risk to reward ratio.
A failed Tweezer formation could serve as a potential point of placing stop-losses. For a bottom formation, stop-losses can be placed below the Tweezers’ low point. Similarly, for a top formation, the stop-loss can be placed above the high.
It is, however, important to know that Tweezers don’t indicate the strength of a trend. This means that it won’t tell you how long the trend reversal is likely to last. They will also not show a probable profit target, which means that the overall momentum is important to consider. These candlestick formations are most effective when found near pre-determined support and resistance levels.
Risk Management is Important
Successful application of technical analysis is dependent on precisely entering a position, when there are several indicators that point towards an advantageous outcome. This concept is known as “confluence,” which means that the best market strategies need to be supported by multiple converging factors. But, there are plenty of instances where candlestick patterns have not converged to predict the same outcomes. Candlestick formations, like other technical indicators, only predict probabilities, rather than guaranteeing outcomes. This is why risk management is important, every step of the way.
Reference Links
- http://www.chart-formations.com/candlestick-patterns/tweezers.aspx
- https://investinganswers.com/dictionary/t/tweezers-candlestick-pattern
- https://www.investopedia.com/articles/active-trading/040714/tweezers-provide-precision-trend-traders.asp
- https://tradesmartu.com/blog/how-to-interpret-the-tweezer-candlestick-pattern/


